America’s aging population is growing rapidly. This ultimate guide brings together the most up-to-date and reliable senior citizens statistics in the U.S. (2025), covering everything from age and gender demographics to income, reading habits, health conditions, and internet use.
Whether you’re a journalist, blogger, researcher, or policy analyst, this data-packed resource is designed to save you time and give you what you need in one place.
2025 U.S. Senior Population Statistics: Size, Growth & Trends
The U.S. is experiencing a rapid demographic shift, with senior citizens making up a larger share of the population than ever before. This section provides up-to-date senior citizens statistics for 2025, offering insights into their population size, growth patterns, and key demographic trends shaping the future.
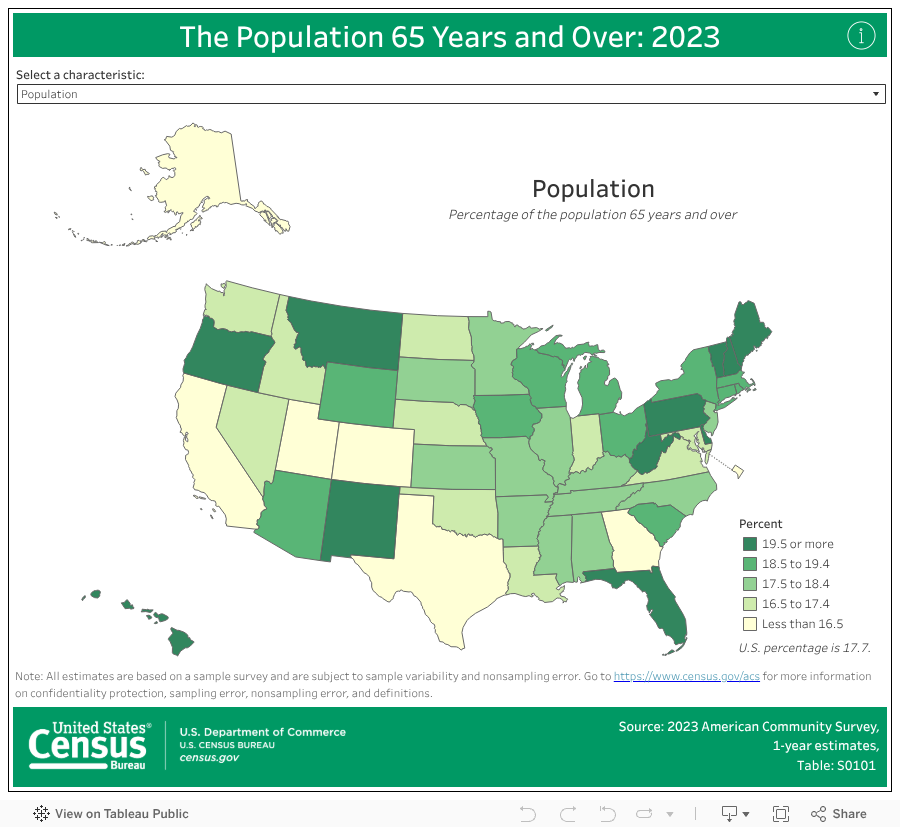
According to the U.S. Census Bureau’s 2024 estimates, there are approximately 59.3 million Americans aged 65 and over, accounting for 17.7% of the total U.S. population.
This marks a significant increase from just 40.3 million in 2010, when seniors made up only 13% of the population.
The Population Reference Bureau (PRB) reports that the senior population stood at 58 million in 2022, and is projected to reach 82 million by 2050, representing a 47% increase over three decades.
U.S. Census Bureau Interactive Chart: The Growth of America’s 65+ Population (2023 Data)
Based on these figures, it is reasonable to estimate that by 2025, the U.S. senior population will be around 60 million.
This makes older adults the fastest-growing age group in the country, driven largely by:
- The aging of the Baby Boomer generation (those born between 1946–1964),
- Increased life expectancy,
- A general decline in birth rates.
The implications of this demographic shift are far-reaching, affecting healthcare systems, housing demand, workforce dynamics, and even political priorities.
In the next section, we’ll take a closer look at the age and gender breakdown of the senior population, highlighting how the 65+ demographic varies by age subgroup and between men and women.
Senior Age Groups and Gender Demographics in the U.S.
What Does “Senior” Mean in This Guide?
In most U.S. federal data sources,
“seniors” refers to individuals aged 65 and over.
Some organizations may use 60 or 62 as the starting point,
but for consistency, this guide follows the U.S. Census Bureau’s 65+ definition.
The senior population in the United States is not a monolith. Senior citizens statistics reveal important distinctions within the 65+ age group by age range and gender—each with its own social, economic, and health implications.
📊 Age Subgroups Within the Senior Population
According to the U.S. Census Bureau’s 2020 data:
65+ population: 55,792,501
- 65 to 69 years old: 18,288,727 (≈ 32.78%)
- 70 to 74 years old: 14,823,238 (≈ 26.57%)
- 75 to 79 years old: 9,955,322 (≈ 17.84%)
- 80 to 84 years old: 6,388,779 (≈ 11.45%)
- 85 years and older: 6,336,435 (≈ 11.36%)
As of 2024 estimates, these proportions have remained relatively stable.
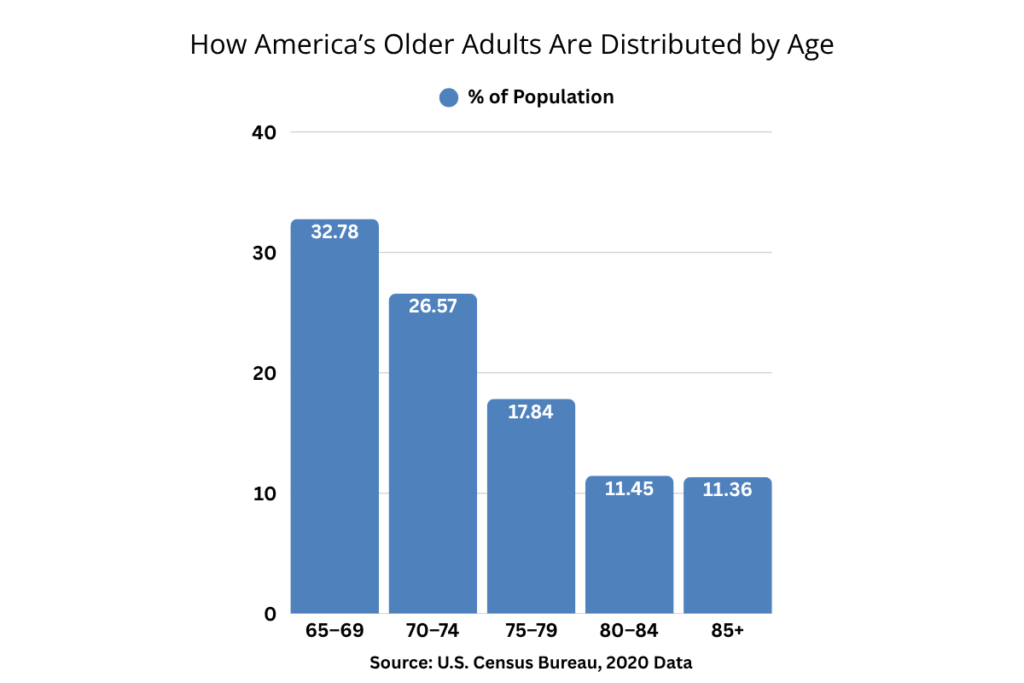
Though the 85+ group is the fastest-growing due to increasing life expectancy and improved medical care, this group is expected to more than double by 2040, reaching close to 14 million individuals.
🧓👵Gender Distribution Among Older Adults
The senior population skews noticeably female, and the gender gap widens with age.
According to the U.S. Census Bureau’s 2020 data:
65+ population: 55,792,501
- Among adults aged 65+, women make up about 55.19%
- Women: 30,793,381 (≈ 55.19%)
- Men: 24,999,120 (≈ 44.81%)
85+ population: 6,336,435
- Among those aged 85+, women represent nearly two-thirds of the population
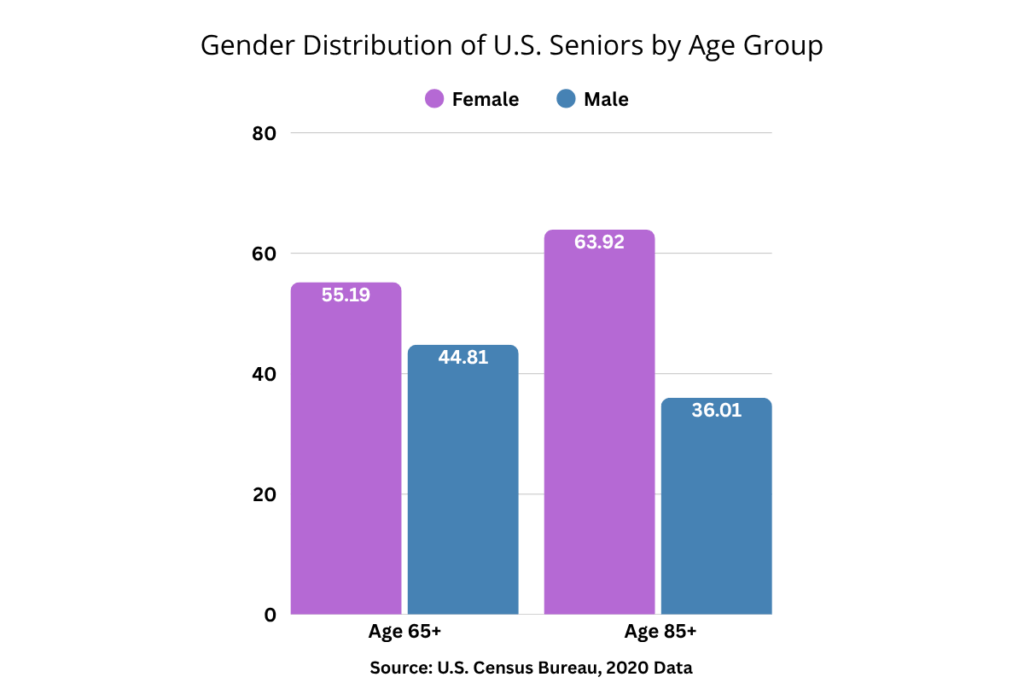
- Women: 4,050,398 (≈ 63.92%)
- Men: 2,286,037 (≈ 36.01%)
This is largely due to women’s longer average life expectancy.
According to the CDC’s 2023 report Mortality in the United States, the current life expectancy is:
- Female: 81.1 years (↑ 0.9 year from 80.2 in 2022)
- Male: 75.8 years (↑ 1.0 year from 74.8 in 2022)
🧠 Why This Matters
These differences in age and gender composition impact everything from:
- Healthcare needs (e.g., long-term care is more often used by women 85+)
- Social isolation risk (older women are more likely to live alone)
- Policy design (such as gender-sensitive retirement planning)
As the senior population continues to grow, understanding its internal structure will be key to designing more effective services and interventions.
Understanding the makeup of the senior population by age and gender is only part of the picture.
In the next section, we’ll explore how race and ethnicity further shape the experiences of older Americans—affecting everything from health outcomes and economic security to cultural expectations around aging and care.
Senior Population by Race and Ethnicity in the U.S.
While aging is a universal experience, the racial and ethnic composition of the senior population in the United States is far from uniform. Understanding how race and ethnicity shape the demographic makeup of adults aged 65 and over is crucial for creating equitable healthcare, housing, and support services.
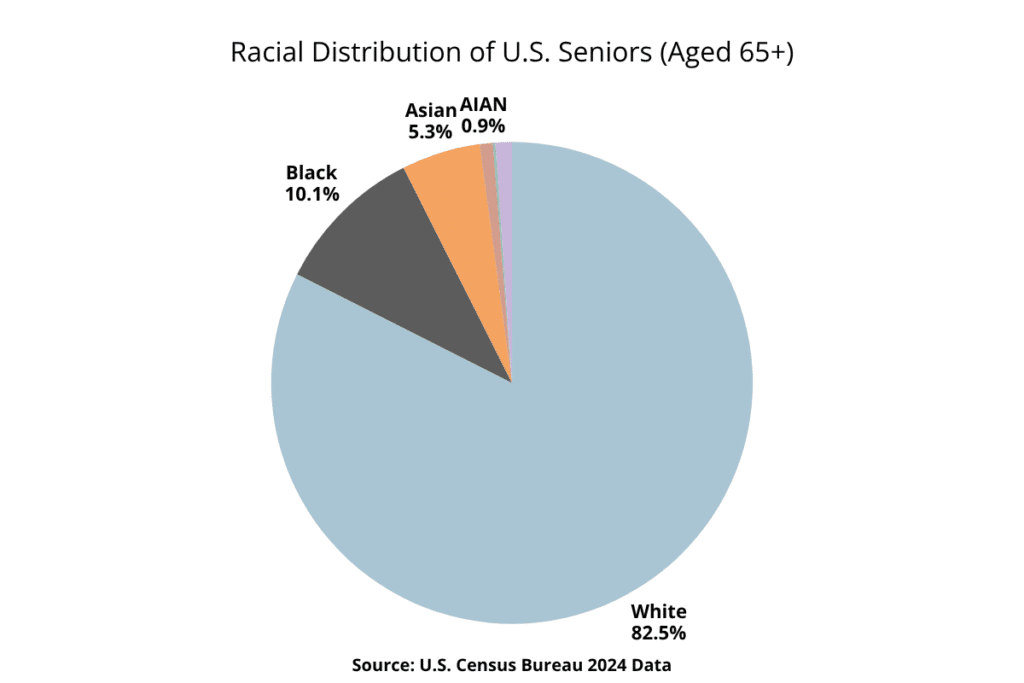
📊 Racial and Ethnic Breakdown
According to the U.S. Census Bureau’s most recent estimates (July, 2024), the racial and ethnic composition of the U.S. senior population (65+) is approximately:
- White: 50,443,027 (≈ 82.48%)
- Black: 6,187,169 (≈ 10.11%)
- Asian: 3,243,557 (≈ 5.30%)
- AIAN: 529,947 (≈ 0.87%)
- NHPI: 97,115 (≈ 0.16%)
- Two or More Races: 679,103 (≈ 1.11%)
While the chart above shows the racial composition of the senior population overall, the chart below further breaks it down by ethnicity, comparing Hispanic and non-Hispanic seniors across different racial groups.
-1024x1024.png)
🧑🤝🧑Hispanic vs. Non-Hispanic Seniors by Race
According to the latest estimates from the U.S. Census Bureau (July 2024), the racial and ethnic makeup of the U.S. senior population aged 65 and over is as follows:
| Race | Hispanic | Non-Hispanic |
| White | 5,402,897 | 45,040,130 |
| Black | 252,155 | 5,935,014 |
| Asian | 50,381 | 3,193,176 |
| American Indian / Alaska Native (AIAN) | 145,756 | 384,191 |
| Native Hawaiian / Pacific Islander (NHPI) | 15,043 | 82,072 |
| Two or More Races | 106,272 | 572,831 |
| TOTAL | 5,972,604 | 58,127,414 |
While the chart above highlights the ethnic breakdown of the senior population by race, the next section explores how these demographics have changed over time. By examining historical trends, we can better understand the shifting racial and ethnic makeup of older Americans and what it may look like in the years to come.
📈 Trends Over Time
According to projections from the U.S. Census Bureau, the senior population (aged 65 and over) in the United States is undergoing a significant demographic shift, becoming more racially and ethnically diverse with each passing decade.
In 2022, non-Hispanic White adults made up approximately 74.9% of the senior population. By 2025, this share is projected to fall to 71.6%, and by 2050, it is expected to decline further to just 55.6%. This long-term trend reflects lower birth rates and aging patterns among non-Hispanic White populations, along with sustained population growth among other groups.
Meanwhile, the proportion of Hispanic or Latino seniors is projected to more than double—from 9.1% in 2022 to 20.4% in 2050. Similarly, Asian seniors are expected to grow from 5.0% to 8.7%, and Black or African American seniors from 9.8% to 13.7% over the same period.
Smaller but steadily growing increases are also projected among multiracial seniors (from 1.1% to 2.5%) and Native populations, including American Indian and Alaska Native (from 0.8% to 1.2%) and Native Hawaiian and Other Pacific Islander (from 0.15% to 0.31%).
These demographic changes are already reshaping the senior care landscape in the United States, influencing policies related to healthcare access, language services, cultural competency, and retirement planning.
📌 Cultural and Health Implications
As America’s senior population becomes more racially and ethnically diverse, their cultural backgrounds and healthcare needs are changing too.
Different groups bring different languages, traditions, and family expectations. Senior care providers will need to adapt—offering more culturally familiar food, activities, and multilingual support.
Health challenges also vary. For example, Hispanic and Black seniors may face higher rates of conditions like diabetes or high blood pressure. Asian and Pacific Islander seniors may have different risks. To provide good care, services must be tailored to these differences.
In short, a more diverse senior population means healthcare and support systems must become more inclusive, respectful, and flexible.
🧠 Why This Matters
America’s senior population is not only growing—it’s changing. By 2050, over 40% of adults aged 65 and older will be from racial or ethnic minority groups.
This shift means that aging-related policies, healthcare services, and senior programs can no longer take a one-size-fits-all approach. Cultural values, language needs, and health risks differ across communities. If these differences aren’t acknowledged, it can lead to gaps in care, mistrust, and worse outcomes.
Understanding who our seniors are—and who they are becoming—is essential to creating a future where every older adult can age with dignity, respect, and proper support.
As the senior population grows and changes, so do their living needs. Where and how older adults live—whether alone, with family, or in care facilities—has a big impact on their health, comfort, and daily life. Let’s take a closer look at the living arrangements shaping the experience of aging in the U.S.
Senior Living Arrangements and Housing Options in the U.S.
🧍 Living Alone
Living alone is a common and increasingly prevalent arrangement among older Americans—especially women aged 75 and over.
According to the U.S. Census Bureau:
- 27% of women aged 65–74 live alone.
- This figure jumps to 43% for women aged 75 and over.
- In contrast, only 21% of men aged 65–74 and 24% of men aged 75+ live alone.
- Men aged 75+ are nearly twice as likely (67%) to live with a spouse as women (35%).

📊 These differences are primarily due to women’s longer life expectancy, which leads to higher rates of widowhood and independent living in later life.
📌 Why It Matters:
Living alone offers independence and autonomy, but also increases the risk of:
- Safety concerns (e.g., falls, medical emergencies)
- Social isolation and loneliness
- Difficulty accessing healthcare or transportation
While many seniors in the U.S. live alone and value their independence, a significant portion choose—or need—to live with family members. These multigenerational arrangements can offer emotional support, shared responsibilities, and practical caregiving solutions, especially as needs increase with age.
👨👩👧 Living with Family or Multigenerational Households
As the U.S. population ages and diversifies, more older Americans are living in multigenerational households—homes that include at least two adult generations or a “skipped generation” arrangement, such as grandparents living with grandchildren. These arrangements reflect a combination of cultural traditions, financial necessity, caregiving needs, and shifting social norms.
📊 Key Statistics
- In 2021, an estimated 59.7 million people in the U.S.—18% of the population—lived in multigenerational households, quadruple the number in 1971.
- 20% of women aged 65+ and 15% of men aged 65+ lived in multigenerational households in 2021.

- Multigenerational living is most common among:
- Asian (24%), Black (26%), and Hispanic (26%) Americans.
- Compared to White Americans (13%).
- Immigrants (26%) are more likely than U.S.-born adults (17%) to live in such households.
- Regional differences:
- Most common in the West (21%), followed by the South (19%), Northeast (19%), and Midwest (14%).
💡 Why Do People Choose This Arrangement?
According to Pew Research Center:
- 40% of adults in multigenerational households cite financial issues as a major reason for their living arrangement.
- 25% cite caregiving for an adult, and 12% mention child care.
- 28% say it’s the arrangement they’ve always had.
- Others cite companionship (12%), relationship changes like divorce or widowhood (15%), or the COVID-19 pandemic (13%).
Caregiving is not just a reason—it’s a reality for many:
- 25% of multigenerational households actively engage in caregiving, either for an adult or a child.
- Adults living with a parent aged 65 or older are nearly three times as likely to provide personal care for another adult in the home than those living with a younger parent (23% vs. 8%).
💰 Financial Impacts
Multigenerational households offer a financial safety net, particularly for low-income families:
- 10% of people in multigenerational homes live in poverty, compared to 12% in other households.
- Among adults aged 85+, poverty is 8% in multigenerational homes vs. 13% in other settings.
- Among the unemployed, poverty is 11% in multigenerational homes vs. 19% elsewhere.
- Adults with disabilities: poverty is 16% in multigenerational households vs. 27% in other households.

However, financial strain can fall unevenly:
- 53% of adult children living with a parent say the arrangement helps them financially.
- Only 29% of parents living with an adult child say the same—and 28% say it hurts their finances.
Rent and expenses:
- 63% of parents with an adult child say they pay more than half of rent/mortgage; 51% pay it all.
- 30% of adult children say they pay none of the rent.
- 37% of multigenerational household members pay all grocery and utility bills; 6% pay none.
Want a deeper breakdown of what older adults spend on rent across the U.S.? Here’s how much seniors themselves are paying for rent.
🧠 Lived Experience
Despite financial pressures, most people report positive outcomes:

- 56% of adults in multigenerational households describe the experience as at least somewhat positive.
- 58% say it’s convenient most or all of the time.
- 54% say it’s rewarding.
- However, 23% say it is stressful most or all of the time:
- Especially common among adult children living with a parent (31%) vs. parents living with adult children (18%).
Gender and age affect perceptions:
- Women are more likely than men to do most household chores (66% vs. 56%).
- Adults aged 40+ are more likely than younger adults to say they do all the chores (34% vs. 15%) and see the arrangement as long-term (66% vs. 30%).
🏠 Long-Term or Temporary?
- Overall, 41% say their living situation is long-term; 34% say temporary.
- Among adults 40+ living with a parent, 66% say it’s long-term.
- Among those 25–39, 49% see it as temporary.
While many older adults find comfort and connection in multigenerational households, this living arrangement isn’t ideal—or possible—for everyone.
As needs increase or personal preferences shift, some seniors explore more structured options that still offer independence, support, and community. That’s where assisted living and independent living communities come into play.
🏘️ Assisted Living and Independent Living Communities
Assisted living and independent living communities are two of the most common senior housing options in the U.S., offering different levels of support and autonomy based on residents’ needs.
📊 Key Statistics and Demographics
👥 Population & Facility Numbers
- Assisted Living: As of 2021, approximately 818,800 Americans live in assisted living communities—about 88% of all residential care residents in the U.S. There are over 30,600 licensed assisted living facilities nationwide, with an average occupancy rate near 80%.
Source: A Place for Mom - Independent Living: Roughly 960,000 older Americans live in independent living communities.
Source: American Seniors Housing Association (ASHA)
🧓 Age Profile
- The average age of residents:
- Assisted living: 84.5 years
- Independent living: 82.8 years
Source: American Seniors Housing Association (ASHA)
👩⚕️ Gender Distribution
- Over 70% of residents in both types of communities are women, due in part to longer life expectancy.
Source: Research and Markets
💰 Average Monthly Costs
- Assisted Living: $4,500/month (national average, varies by state and facility)
- Independent Living: $2,750/month (depending on amenities and location)
Most assisted living costs are not covered by Medicare—residents typically pay out-of-pocket or through long-term care insurance.
Source: Volante Senior Living
🏢 Features and Services
| Assisted Living | Independent Living | |
| Avg. Age | 84.5 | 82.8 |
| % Female Residents | 70%+ | 70%+ |
| Avg. Monthly Cost | $4,500 | $2,750 |
| Medical/ADL Support | ✅ Yes | ❌ No |
| Social Activities | ✅ | ✅ |
| Staff On-Site 24/7 | ✅ | ❌ Usually Not |
- Assisted Living:
- Help with activities of daily living (ADLs) like bathing, dressing, and medication
- Meals, housekeeping, laundry, and transportation
- 24/7 staff support and emergency call systems
- Independent Living:
- Private apartments or cottages
- Community dining, scheduled activities, and housekeeping
- Designed for seniors who live independently but enjoy added convenience
📈 Future Trends
The aging Baby Boomer generation is expected to drive a sharp increase in demand.
By 2040, the U.S. may need 1 million additional assisted living beds to meet demand.
Source: A Place for Mom
While assisted and independent living communities provide a balance of autonomy and support, they may not offer the level of medical care required for those with serious health conditions or advanced age-related needs.
For seniors who require around-the-clock supervision, skilled nursing, or rehabilitative services, nursing homes and long-term care facilities become essential options.
🏥 Nursing Homes and Long-Term Care Facilities
Nursing homes and long-term care facilities play a critical role in supporting seniors with chronic health conditions, limited mobility, or cognitive impairments who require continuous medical supervision or assistance with daily activities.
📊 Key Statistics
- Number of Residents:
Approximately 1,294,800 people were residing in nursing homes in the U.S. on a given day. - Age and Gender:
32.8% of nursing home residents were aged 85 or older, while 33.0% were between 75 and 84, 16.2% were between 65 and 74, and 17.9% were under 65. - Assistance with Activities of Daily Living (ADLs):
96.5% of nursing home residents required assistance with bathing, and 60.2% needed help with eating. These findings underscore the high level of support required for basic activities of daily living (ADLs) among nursing home populations.
Assistance with ADLs such as bathing, eating, dressing, and toileting is a key reason individuals enter nursing homes. The overwhelming majority of residents require support with multiple ADLs due to physical, cognitive, or medical limitations, making nursing facilities essential providers of round-the-clock personal and medical care. - Cognitive Impairment:
45.6% of nursing home residents were diagnosed with Alzheimer’s disease or other dementias, indicating a high prevalence of cognitive impairment in long-term care settings.
Cognitive impairment significantly affects residents’ ability to manage daily activities independently and often necessitates specialized memory care and supervision, which are typically provided in nursing home environments. - Length of Stay:
While estimates vary, multiple studies suggest that the average length of stay in a nursing home is approximately 1.5 years. However, the median stay is significantly shorter—around 5 months—indicating that while many residents stay for relatively short periods, a smaller group remains for several years due to chronic health conditions or limited care alternatives.
💰 Cost of Care
The cost of nursing home care in the United States remains one of the most significant financial considerations for older adults and their families. According to 2024 estimates:
- The average monthly cost of a semi-private room is $9,277
- The average monthly cost of a private room is $10,646
Looking ahead, these costs are projected to rise significantly over the next 50 years. Based on current trends:

This represents a 339% increase in the cost of a semi-private room and a 339% increase for a private room by 2074 if current projections hold.
Such rising costs underscore the importance of long-term financial planning, insurance coverage considerations, and understanding government support programs like Medicaid, which remains the primary payer for many nursing home residents.
🛡️ Quality and Regulation
Nursing homes in the United States are subject to strict federal and state regulations designed to ensure the safety, well-being, and dignity of their residents. Oversight is primarily conducted by the Centers for Medicare & Medicaid Services (CMS), which requires all Medicare- and Medicaid-certified facilities to meet a comprehensive set of standards.
CMS Five-Star Quality Rating System
To help families and consumers make informed choices, CMS developed the Five-Star Quality Rating System, which evaluates facilities based on three core areas:
- Health Inspections – Regular, unannounced surveys conducted by state inspectors to assess compliance with federal regulations.
- Staffing – Includes registered nurse (RN) hours per resident per day and total nursing staff hours.
- Quality Measures (QMs) – Clinical data on resident outcomes such as rates of pressure ulcers, falls, and readmissions.
Facilities are assigned an overall star rating (from 1 to 5), with 5 stars indicating “much above average” quality.
Regulatory Oversight
- Federal Level: CMS sets minimum requirements for participation in Medicare and Medicaid programs. Violations can result in fines, loss of certification, or other penalties.
- State Level: State health departments conduct inspections and may impose additional rules or more frequent evaluations.
- Complaint Investigations: In addition to scheduled inspections, facilities are subject to investigation in response to complaints filed by residents, families, or staff.
Transparency Tools
Consumers can access public data about nursing home quality through CMS’s Nursing Home Compare website, which offers detailed information on each facility’s ratings, inspection history, staffing levels, and more.
Source:
Centers for Medicare & Medicaid Services (CMS)
🧠 Emotional and Social Impact
Living in a nursing home can present serious emotional and social challenges. According to the CDC, nearly 50% of residents experience symptoms of depression, often linked to feelings of isolation, reduced autonomy, and limited meaningful interaction.
Many facilities offer activities, family visits, and communal programs to help residents stay socially connected. However, the availability and consistency of these supports can vary, making emotional and social well-being an ongoing concern in long-term care settings.
🏡 Alternative Housing Models
As reflected in recent senior citizens statistics in the U.S., older adults are increasingly exploring housing options beyond traditional nursing homes. From co-housing communities to tiny home villages, these alternative living models offer greater independence, dignity, and flexibility for seniors with varying needs and preferences.
🏘️ Co-housing Communities
Co-housing communities are small neighborhoods where older adults live in private homes but share spaces like gardens, kitchens, and community rooms. These communities focus on independence, mutual support, and social connection, without offering medical care or daily assistance.
| Attribute | Typical Range |
| Community size | 20–30 households |
| Resident age | 60–75 years |
| Monthly cost (est.) | ~$2,750 (similar to independent living) |
| Medical support | ❌ Not included |
| Third-party care allowed | ✅ Yes |
| Ideal for | Active, independent seniors |
While nationwide statistics are limited, most senior co-housing communities:
- Include 20–30 households
- Have residents typically aged 60–75
- Are self-managed and not run by outside staff
Cost varies by location and ownership, but is often similar to independent living, which averaged $2,750/month for a one-bedroom unit in 2023 (Investopedia).
Co-housing appeals to healthy, active seniors who want to age in place with companionship. As the U.S. senior population is expected to reach 84 million by 2054, interest in these alternatives may continue to grow.
Sources:
Grand View Research. U.S. Senior Living Market Report (2024).
Investopedia. The Cost of Living in a Retirement Community.
Seniorsite.org. Senior Cohousing in 2025
🧓 Adult Foster Care / Adult Family Homes
Adult foster care—also known as adult family homes, adult residential care, or elderly foster care—provides seniors with housing, meals, and assistance with daily activities in a small, home-like environment. These homes are typically state-licensed and run by trained caregivers, many of whom live on-site.
| Attribute | Typical Range |
| Residents per home | Usually 4–6; limited to ≤5 in most states |
| Care provided | Personal care, ADLs, supervision |
| Medical staff | ❌ Not provided on-site |
| Cost estimate | $2,000–$5,000/month |
| Funding | Private pay; some Medicaid coverage |
| Best for | Seniors needing personalized care in small homes |
Key Characteristics:
- Small scale: Most states limit adult foster homes to no more than five residents. A typical range is 4 to 6 individuals, allowing for personalized, routine-based care.
- Personal care services: Includes help with bathing, dressing, eating, mobility, and medication reminders.
- Medical care not included: These homes do not offer 24/7 skilled nursing care, though residents may receive outside help from home health agencies.
- Staffing: Caregivers are usually present 24/7, but not always awake overnight.
- Environment: More common in rural or suburban areas than in high-density cities.
Estimated Cost:
- $2,000 to $5,000 per month, depending on state, location, and level of care needed.
- Some homes accept Medicaid or state-specific programs for care costs (but not for room and board).
Best for:
- Seniors needing moderate help with daily activities
- Those who prefer a quiet, family-style atmosphere over large group settings
Sources:
Paying for Senior Care.com. Adult-Foster-Care
👫 Shared Housing
Shared housing—also known as home-sharing—is an increasingly popular living arrangement where two or more unrelated people share a residence. Among older adults, it’s gaining momentum as a way to reduce housing costs, combat loneliness, and remain independent without moving into formal care settings.
| Attribute | Details |
| Typical Age Groups | Adults 55+, especially 65+ |
| Estimated Size | 1 million+ shared households among 55+ adults (15% share) |
| Growth Rate | +48% (65+) and +40% (55–64) in roommate listings, 2023–2024 |
| Monthly Rent | Varies; often $900–$1,600 depending on location |
| Key Benefits | Affordability, companionship, aging in place |
| Challenges | Need for compatibility, reduced privacy |
| Supportive Policies | HUD vouchers, state law reforms, intergenerational programs |
📈 Growing Among Older Adults
- As of 2025, adults aged 55 and older account for over 1 million people, or 15% of all house-sharing households, up from just 6.8% in 2005.
- This group has seen the most significant growth in shared housing since the mid-2000s, reflecting shifting lifestyle preferences and a desire to age in place affordably.
- A 2024 study by SpareRoom found that the 65+ age group is the fastest-growing segment of Americans advertising for roommates, rising 48% between 2023 and 2024. Those aged 55–64 followed closely behind with 40% growth.
💰 Affordability & Mutual Support
Shared housing helps seniors:
- Lower monthly expenses by splitting rent, utilities, and food
- Remain in familiar neighborhoods longer
- Find companionship and informal assistance in daily routines
In one real-life case, a 61-year-old woman in Tampa moved into a six-bedroom shared house and developed a strong bond with a younger housemate who now helps her with errands and medical appointments.
🏛️ Policy & Design Support
- States like Colorado, Iowa, Oregon, and Washington have updated housing laws to remove family-based occupancy restrictions, encouraging home-sharing.
- In 2021, HUD began allowing housing vouchers to be used for shared housing arrangements.
- A Harvard symposium on intergenerational housing emphasized how thoughtful design—like placing laundry rooms near rooftop gardens—can promote connection.
- Programs such as Nesterly are connecting older homeowners with younger renters, creating intergenerational support systems.
Sources:
Vox. Why more Americans are moving in with strangers twice their age.
Nypost. How Baby Boomer ‘Boommates’ are beating inflation and loneliness: ‘I’m happy as a clam’
Kiplinger. Why More Retirees Are Taking on Tenants
NAHB. House Sharing Reaches All-Time High as Affordability Issues Linger
🪴 Green House Model
Established in 2003, the Green House Project has developed nearly 400 homes across 35 U.S. states and Australia. Each residence typically accommodates 10–12 elders, offering private bedrooms and bathrooms, communal living spaces, and open kitchens to foster a homelike atmosphere.
Key Features:
- Enhanced Care: Residents receive 23–31 minutes more direct care per day compared to traditional nursing homes, with staff spending over four times as much time engaging with elders outside of direct care activities.
- Lower Staff Turnover: Green House homes report significantly lower staff turnover rates—33.5% for certified nursing assistants (CNAs), 41.6% for licensed practical nurses (LPNs), and 63.2% for registered nurses (RNs)—compared to national averages of 129.1% for CNAs, 114.1% for LPNs, and 140.7% for RNs.
- Higher Occupancy Rates: During the COVID-19 pandemic, Green House homes maintained occupancy rates of 93% in May 2021, surpassing the national average of 74.2% for traditional nursing homes.
- Cost Efficiency: Residents in Green House homes incur $1,300 to $2,300 less in total Medicare and Medicaid costs annually compared to those in traditional nursing homes.
- Improved Health Outcomes: Elders in Green House homes experience fewer hospitalizations and report better physical and emotional well-being than those in conventional nursing facilities.
📊 Green House Model vs. Traditional Nursing Homes
| Feature / Metric | 🪴 Green House Model | 🏥 Traditional Nursing Homes |
| Home Size | 10–12 residents per house | 80–120+ residents per facility (average) |
| Staff-to-Resident Relationship | Deep, consistent relationships with caregivers | Rotating staff; less personal contact |
| Direct Care Time (per day) | 23–31 minutes more than traditional homes | Less time spent per resident |
| Non-care Interaction | 4x more engagement outside direct care | Minimal due to staff shortages |
| Staff Turnover (CNAs) | 33.5% | 129.1% |
| COVID-era Occupancy (2021) | 93% | 74.2% |
| Medicare/Medicaid Annual Savings | $1,300–$2,300 per resident | Higher overall care costs |
| Physical Environment | Private rooms, open kitchens, communal dining | Shared rooms, institutional settings |
| Regulatory Category | Licensed as skilled nursing but operates like a home | Skilled nursing facility |
| Health & Well-being | Fewer hospitalizations, better emotional outcomes | Higher rates of hospitalization and depression |
🧓 What This Means for Older Adults
The Green House Model offers more than just a smaller home—it provides personal dignity, deeper caregiver relationships, and a calmer, homelike atmosphere that fosters emotional and physical well-being. For seniors, this means:
- Less loneliness and isolation, thanks to consistent daily engagement
- Better health outcomes with fewer hospital visits and more attention
- Greater autonomy in daily life, including meal choices and routines
- Stronger emotional bonds with staff and fellow residents
- Reduced exposure to institutional stressors common in traditional nursing homes
In short, the Green House Model reflects a shift from care as a system to care as a relationship—something especially vital as older adults seek not only longer life, but better living.
Sources:
Thegreenhouseproject. Be the Disrupter, Not the Disrupted
Thegreenhouseproject. The Green House DifferenceBy the Numbers
Claudepeppercenter. The Green House Project New Research and the Future of Small Homes
Wikipedia.Green House Project
🧑⚕️ Program of All-Inclusive Care for the Elderly (PACE)
The Program of All-Inclusive Care for the Elderly (PACE) is a comprehensive, fully integrated health care model designed to help older adults remain in their communities while receiving coordinated medical and long-term services.
🎯 Eligibility and Enrollment
- Individuals must be 55 years or older
- Require a nursing facility level of care
- Able to live safely in the community with PACE support
- Must live in a PACE service area
As of March 2025:
- 183 organizations operate 285 PACE centers across 33 states + D.C.
- Serving approximately 83,000 participants nationwide
(Source: MACPAC June 2025, Table 4-1)
🏥 What PACE Covers
PACE provides all Medicare and Medicaid-covered services and more, including:
- Primary & specialty medical care
- Prescription drugs
- Adult day health care
- Transportation
- Rehabilitative therapies
- In-home personal care
- Social services
- Hospital & nursing home care (when needed)
Services are coordinated by an interdisciplinary care team and are often delivered at PACE centers with support for home-based care.
📈 Program Outcomes and Benefits
- Voluntary disenrollment rate is low — around 2.5% annually, suggesting high satisfaction
- Participants often experience fewer hospitalizations and emergency room visits
- States pay PACE plans 12% less on average than for comparable beneficiaries in other Medicaid delivery systems
(Source: MACPAC June 2025, Pages 2–6)
🧭 Limitations and Access
The model relies heavily on capitated payments, making expansion complex for some states
PACE is only available in approved service areas and may have limited enrollment capacity
Enrollees must receive all medical care through the PACE organization, which may involve switching providers
📊 Comparison Table: PACE vs. Green House vs. Traditional Nursing Homes
| Feature / Category | 🧑⚕️ PACE | 🪴 Green House Model | 🏥 Traditional Nursing Home |
| Target Population | 55+ needing nursing-level care, community-safe | Elders needing 24/7 long-term care | Elders needing 24/7 long-term/skilled care |
| Living Setting | Community-based; participants live at home | Residential homes (10–12 residents each) | Institutional facility (avg. 80–120 residents) |
| Medical Services | Full Medicare + Medicaid + support services | Nursing-level care; no hospital-level services | Full medical/skilled nursing services |
| Delivery Site | PACE center + in-home support | On-site in Green House residences | On-site in facility |
| Payment Structure | Fully capitated; includes all care costs | Medicaid/Medicare; possibly private pay | Medicaid, Medicare, private pay, long-term care ins. |
| Staffing Model | Interdisciplinary team; community coordination | Consistent staff in close contact with residents | Larger staff rotation; institutional shifts |
| Daily Life / Autonomy | Participants live in own homes | Residents have private rooms, shared meals | Shared rooms common, institutional routines |
| Personalization of Care | High (coordinated & integrated) | Very high (deep relationships, home life) | Moderate to low depending on facility |
| Hospitalization Rates | Lower than national average | Lower than traditional nursing homes | Higher rates of ER visits and hospitalizations |
| Program Size (2025) | 83,000 participants, 285 centers (33 states) | 400 homes across 35 states | 1.3 million residents in 15,600 facilities |
| Disenrollment / Turnover | Very low voluntary disenrollment (~2.5%) | Low resident and staff turnover | High staff turnover; some resident dissatisfaction |
✅ Key Similarities
- All serve older adults who require substantial assistance or supervision
- All are regulated and subject to state/federal oversight
- All aim to improve quality of life and reduce unnecessary hospitalization
- All may involve Medicare/Medicaid financing (though differently structured)
🔍 What Sets Them Apart
- 🧑⚕️PACE: For those who want to stay at home with coordinated care; ideal for independence + medical needs
- 🪴Green House: For those needing residential care in a home-style environment with deep personal attention
- 🏥Traditional Nursing Home: For those needing institutional care, often with more complex medical needs or less ability to live independently
🛖 Tiny Home Villages / Granny Pods
As housing affordability and long-term care costs continue to rise, tiny home villages and “granny pods” have emerged as alternative housing models that allow older adults to live more independently, affordably, and closer to loved ones.
🏘️ Tiny Home Villages: Community-Integrated Micro Housing
Tiny home villages are clusters of small, freestanding homes (typically 100–500 sq ft) organized around shared spaces like gardens, walking paths, or community rooms. While often launched by nonprofits or municipalities, they are gaining traction as a scalable solution for aging populations—especially low-income or housing-insecure seniors.
Key features:
- Community-oriented design with private residences and shared amenities
- Lower development costs compared to traditional senior housing
- Adaptability for barrier-free aging-in-place designs
Real-world examples:
- OurCalling Village in Dallas, TX plans to build 500 tiny homes with integrated medical and social services for older and disabled individuals.
- 12 Neighbours in Canada (as a reference model): 96 completed units for permanent supportive housing.
🏡 Granny Pods: Backyard Housing for Intergenerational Support
Granny pods—also called MEDCottages or accessory dwelling units (ADUs)—are small, fully equipped residences built in a family’s backyard to house an aging parent.
Key features:
- Independent living with proximity to family
- Health-focused design, including handrails, wide doorways, anti-slip flooring
- Smart features such as emergency monitoring or remote health tracking
Estimated costs:
$80,000–$100,000 depending on size, site work, and customization
Source:
Vibrant Aging Insider. Granny Pods: the Ultimate in Senior Living?
While innovative housing models offer new solutions for senior living, it’s equally important to understand who is using which types of housing—and why. Demographic factors such as age and race play a major role in shaping these decisions. The following section dives into the senior citizens statistics that reveal how living arrangements differ across diverse groups.
📊 Living Arrangements by Age & Race
Some of the most insightful senior citizens statistics reveal how living arrangements differ by age and race. These patterns reflect cultural norms, economic conditions, and shifting family dynamics—offering a clearer view of how older adults across demographic groups experience daily life and housing in the U.S.
🧓 Living Arrangements by Age Group
As people age, their living arrangements shift in response to changes in health, relationships, and financial stability. According to recent senior citizens statistics, these shifts vary significantly across age groups—especially between men and women.
In 2022, 27% of women aged 65–74 lived alone. This figure rose sharply to 43% among women aged 75 and older, reflecting longer female life expectancy and a higher likelihood of widowhood. In contrast, only 18.6% of men aged 75+ were widowed, and nearly 44% continued to live with a spouse. Among men aged 65–74, 68.7% lived with a spouse, compared to just 55.5% of women in the same age group.
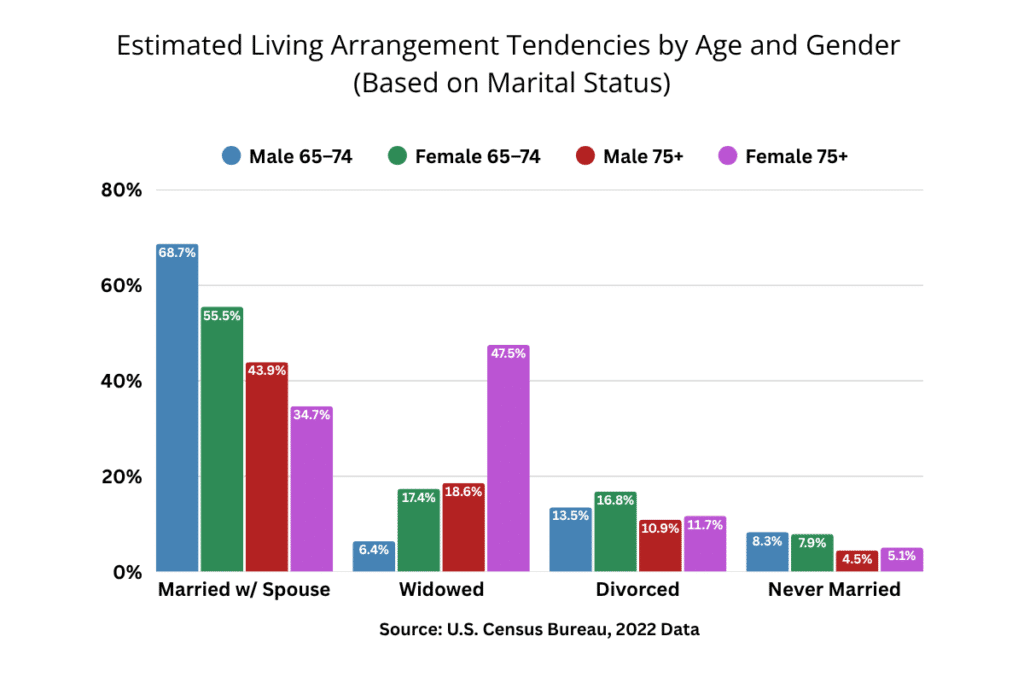
Figure: Marital Status of Older Adults by Age and Gender (2022)
While this chart shows marital status rather than direct living arrangements, the two are closely linked—especially among seniors. Being widowed, divorced, or never married greatly increases the likelihood of living alone, particularly for women aged 75 and older. In contrast, seniors living with a spouse are more likely to share a household. These relationship patterns help explain the rise in solo living with age, and why women are disproportionately affected.
Marriage history helps explain these trends. The 2021 SIPP data shows that older women are more likely to have outlived their spouses and less likely to remarry, leaving them more vulnerable to isolation or living alone. Meanwhile, older men—especially those 65–74—remain far more likely to live with a partner.
Poverty status adds another layer. The majority of seniors living below the poverty line in 2021 lived alone—more than twice the rate of their non-poor peers. Among poor seniors who lived with others, 29.9% lived with a child, and 11.2% lived with a grandchild, underscoring the role of intergenerational support in economically strained households.
These patterns highlight the need for diverse senior housing solutions that account not just for age, but for gender and income as well.
Source:
Census. America’s Families and Living Arrangements: 2022
🌍 Living Arrangements by Race and Ethnicity
Senior citizens statistics reveal striking racial and cultural differences in how older adults structure their living arrangements. While aging brings common challenges, such as declining health or income, race and ethnicity significantly shape how seniors respond to these pressures—especially when it comes to whether they live alone, with a spouse, or in multigenerational households.
According to Pew Research Center, about 26% of Hispanic, Black, and Asian Americans aged 65 and older live in multigenerational households, compared with just 13% of non-Hispanic White seniors.

This trend is partly rooted in cultural values that emphasize familial responsibility, especially in Hispanic and Asian communities, and partly driven by economic realities like lower retirement income and housing access among minority groups.
Multigenerational living offers both practical and emotional support. Census-based senior citizens statistics show that older adults in multigenerational homes have a lower poverty rate (10%) than those in other arrangements (12%), with the sharpest benefits observed among Black, Hispanic, and unemployed seniors. The arrangement also provides caregiving support—23% of adults living with a parent aged 65+ report providing personal care for another household member.
However, experiences vary. Pew’s 2021 survey found that 56% of adults in multigenerational homes described the experience as mostly positive, with more than half calling it convenient and rewarding. Yet 23% also said it was stressful, particularly among younger adults living with parents. Crowded conditions and uneven division of household responsibilities—especially among lower-income and female residents—contribute to these tensions.
In contrast, non-Hispanic White seniors are far more likely to live alone, often due to higher widowhood rates among older women and greater financial independence. For instance, 47.5% of White women aged 75+ are widowed, compared with just 18.6% of men in the same age group. These gender and marital status patterns directly impact household structure, explaining why older White women make up a large share of seniors living alone.
Together, these findings highlight that senior housing policies must account for racial, cultural, and economic diversity. From designing flexible living spaces to offering financial support for caregivers, solutions must reflect the full spectrum of how older Americans live—and how they thrive.
Source:
Census. America’s Families and Living Arrangements: 2022
Pew Research Center. The Share of Americans Living in Multigenerational Households Continues to Rise, 2022
🔀 Intersection: Age x Race (Cross Tabulated Insights)
Senior citizens statistics highlight how the intersection of age and race shapes living arrangements in profound ways. While age naturally influences living preferences and caregiving needs, racial and cultural backgrounds further determine whether older adults live alone, with family, or in multigenerational households.
For example, non-Hispanic White women aged 75 and older are among the most likely to live alone. According to U.S. Census data, 47.5% of White women in this age group are widowed, while only 34.7% live with a spouse. This reflects both longer life expectancy and lower remarriage rates among older White women, resulting in a higher likelihood of living alone—often without nearby family support.
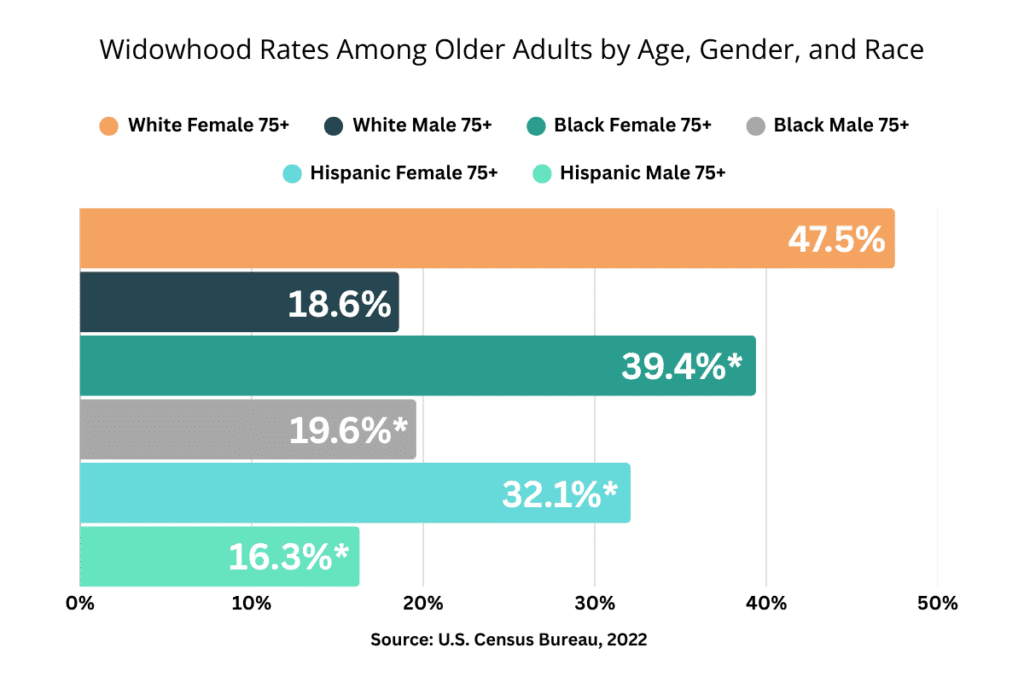
Figure: Widowhood Rates Among Older Adults by Age, Gender, and Race
Widowhood rates among seniors aged 75+ vary significantly by race and gender. White women are most likely to be widowed, contributing to their higher likelihood of living alone.
Note: Figures for Black and Hispanic seniors are estimated based on known trends and are included for comparative purposes.
By contrast, older Hispanic, Black, and Asian Americans are significantly more likely to live in multigenerational households, where caregiving responsibilities and financial burdens are shared. Pew Research Center data shows that 26% of seniors in these groups reside with adult children or grandchildren, compared to only 13% of non-Hispanic White seniors. Cultural values around familial obligation and respect for elders contribute to this pattern, especially in Hispanic and Asian communities.
Age deepens these racial differences. Among adults aged 85 and older, poverty rates are markedly lower for those living in multigenerational households—8% versus 13% for those in other living arrangements. These protective effects are especially strong among economically vulnerable groups. For instance, Hispanic seniors in multigenerational households have a poverty rate of just 13%, compared to 19% for their peers in other settings.
Taken together, these findings suggest that aging cannot be understood through age alone. Race, culture, and economic status intersect to influence not just where seniors live, but how well they live. For policy makers, understanding these patterns is critical to designing housing and social support systems that reflect the diverse realities of aging in America.
Source:
Census. America’s Families and Living Arrangements: 2022
Pew Research Center. The Share of Americans Living in Multigenerational Households Continues to Rise, 2022
Marriage, Family Structure, and Household Size Among Seniors
Marriage, family structure, and household size play a crucial role in shaping the daily lives and well-being of older Americans. Senior citizens statistics show that as people age, their living arrangements often shift due to changes in marital status, health, or family dynamics. This section explores how these factors intersect, offering a detailed look at the diverse ways seniors in the U.S. live and connect with others in 2025.
💍Marital Status Breakdown
Marital status significantly influences the emotional, social, and economic well-being of older adults in the U.S. It shapes everything from household structure to caregiving needs and long-term housing decisions.
According to the 2022 data from the U.S. Census Bureau’s Current Population Survey, the marital landscape of seniors (65+) reflects a complex mix of long-term partnerships, widowhood, and growing rates of divorce and singlehood.
📊 Overall Marital Status of Seniors
Among Americans aged 65 and older, the breakdown is as follows:
| Marital Status | Percentage |
| Married, spouse present | 56.5% |
| Married, spouse absent | 1.3% |
| Widowed | 21.2% |
| Divorced | 13.3% |
| Separated | 1.1% |
| Never married | 6.6% |

More than half (56.5%) of older adults are currently married and living with their spouse. However, widowhood remains a defining feature of aging, affecting over 1 in 5 seniors. Additionally, 13.3% are divorced—highlighting the long-term effects of the rising divorce rates of the 1970s–1990s.
👵 Gender Differences: Men Are More Likely to Be Married
The marital status of older men and women diverges sharply:
| Gender | Married (Spouse Present) | Widowed | Divorced | Never Married |
| Men 65+ | 67.9% | 10.9% | 11.6% | 6.7% |
| Women 65+ | 46.9% | 29.9% | 14.7% | 6.4% |
Key insights:
- Older men are far more likely to be married than women—68% vs. 47%.
- Nearly 1 in 3 women aged 65+ are widowed, compared to only 1 in 10 men.
- Divorce rates are higher among women (14.7%) than men (9.9%) in later life.
This imbalance reflects differences in life expectancy and remarriage trends. Men are more likely to remarry after divorce or widowhood, while women tend to remain single.
📉 Marriage Declines with Age
As age increases, the percentage of married individuals declines while widowhood increases:
- Among 65–74 year-olds, 61.7% are married (spouse present); widowhood rate is 12.2%.
- Among those 75+, only 48.6% are married, while 34.7% are widowed.
This shift underscores the growing need for social support systems and housing solutions tailored to seniors who live alone due to widowhood or divorce
🧾 Summary
Understanding marital patterns is a key part of senior citizens statistics, with wide-reaching effects on health, housing, and care needs. While most senior men are still married, women are more likely to be widowed or divorced and live alone. These shifts highlight critical planning needs for an aging and increasingly diverse population.
Source:
Census. America’s Families and Living Arrangements: 2022
Types of Living Arrangements
Living arrangements shape the way older adults experience aging—impacting their health, caregiving needs, and economic stability. While many seniors live independently or with a spouse, an increasing number are part of complex, multigenerational households.
🧍 Most Common Living Arrangements
According to the Pewresearch.org:
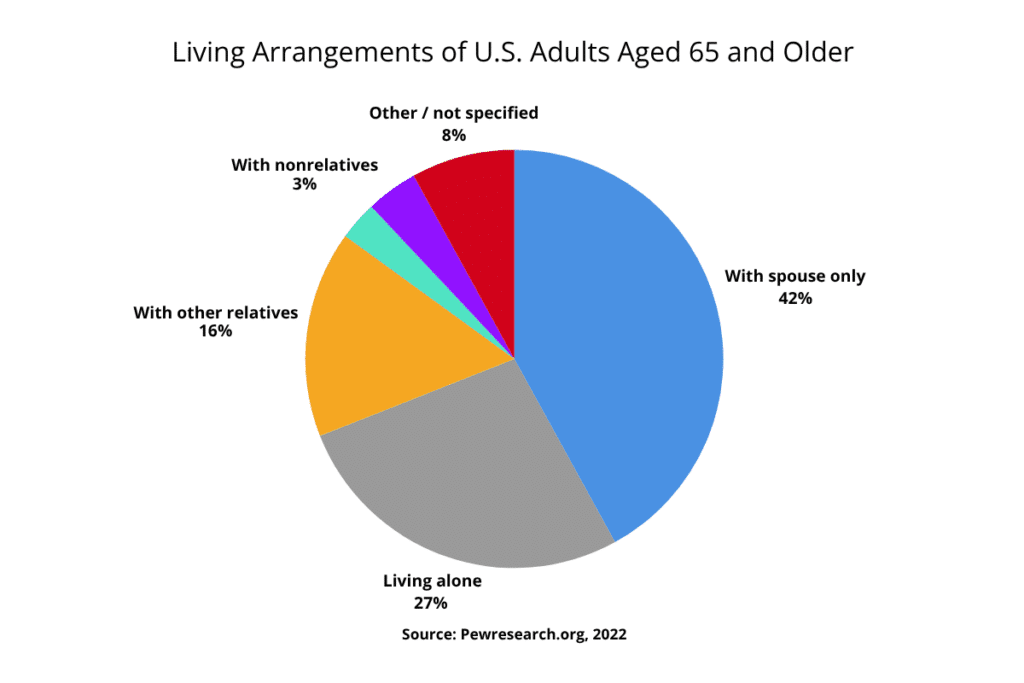
- 42% of seniors live with a spouse only
- 27% live alone, more common among older women
- 16% live with other relatives
- 3% live with nonrelatives
- 4% reside in group quarters, such as assisted living or nursing homes
Older women are significantly more likely to live alone, especially after age 75. In contrast, older men are more likely to live with a spouse.
👨👩👧 Rise of Multigenerational Households
One of the most notable shifts in senior living is the growth of multigenerational households, where seniors live with their adult children, grandchildren, or both.

- As of 2021, 59.7 million Americans lived in multigenerational households—quadruple the number in 1971.
- The share of the U.S. population in these homes has grown from 7% to 18% over five decades.
- 20% of women aged 65+ and 15% of men aged 65+ live in such arrangements.
This growth is driven by:
- Rising housing costs and economic pressures
- Caregiving needs across generations
- Shifting cultural norms, especially in Asian, Black, Hispanic, and immigrant communities
Even among non-Hispanic White Americans, multigenerational living has increased notably in recent years.
💸 Economic and Social Dynamics
Multigenerational households often offer financial protection:
- Seniors living in these households are less likely to live in poverty than those in other arrangements (e.g., 8% vs. 13% poverty rate for those aged 85+).
- For unemployed or disabled adults, living with family reduces poverty rates by up to 11 percentage points.
- While shared housing can ease burdens, lower-income seniors are more likely to report space limitations or financial strain.
Responsibility for household expenses and care varies widely:
- 51% of parents living with adult children pay all the rent or mortgage.
- 30% of adult children living with a parent pay nothing toward housing.
- 27% of adults in multigenerational homes say they do all household chores; women are more likely than men to report this.
❤️ Emotional Experience and Caregiving
While caregiving is often a reason for forming a multigenerational home, only 1 in 4 say it actively occurs in their household.
- 23% of seniors living with adult children say they receive care
- 58% of adults say the arrangement is convenient, and 54% find it rewarding
- Still, 23% report it is stressful most of the time, especially younger adults (ages 25–39) living with parents
Despite occasional challenges, over half of adults in multigenerational homes rate their experience as positive, with the highest satisfaction reported among upper-income households.
📏Average Household Size and Living Companions
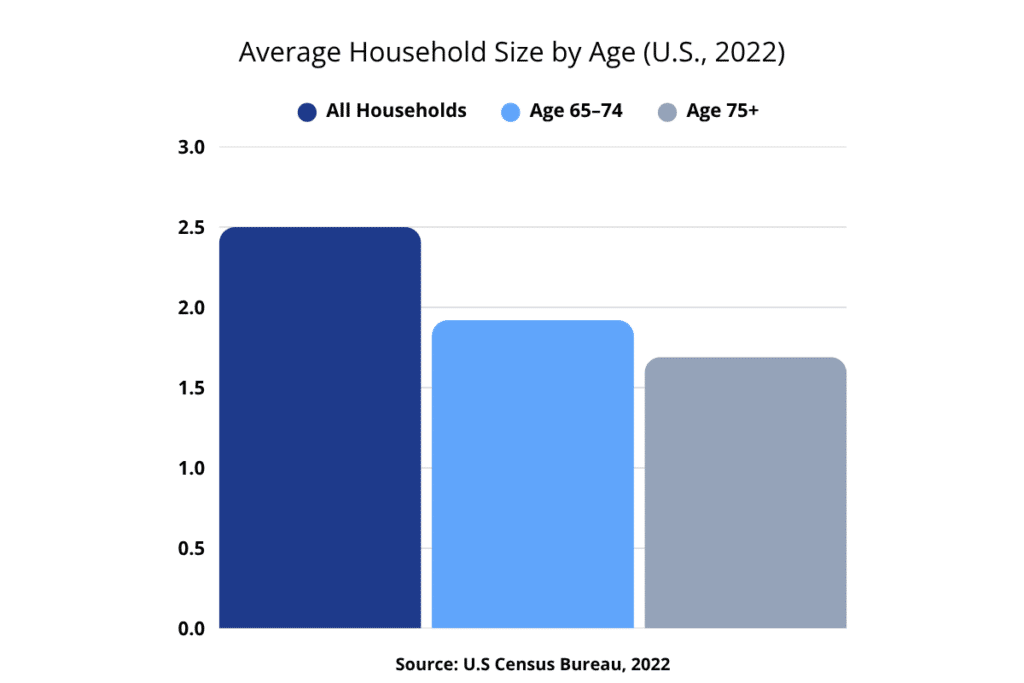
Older Americans have diverse living arrangements, with significant variation by age, marital status, and household type. According to the U.S. Census Bureau’s 2022 Current Population Survey, the average household size for people aged 65 to 74 is 1.92, and for those 75 and older, it’s 1.69. In comparison, the average household size across all U.S. households is 2.50.
This indicates that many older adults—especially those over 75—are living in smaller households, often with just one or two people. In fact, data show that among all U.S. households:
- 38.9 million (29.6%) are one-person households, and
- Among nonfamily households, 98% of households with 65+ householders are either one-person or two-person households.
In terms of household composition:
- Many older adults live with a spouse or partner only, while others live alone, with adult children, or in multigenerational households.
- The average number of adults (18+) per household for those aged 65–74 is 1.83, and for those 75+, it drops to 1.64, further underscoring the trend toward solitary or small household living.
These patterns have meaningful implications:
- Seniors living alone may face higher risks of social isolation and limited daily support.
- Those living with others—particularly family—may benefit from emotional companionship, financial sharing, and caregiving assistance.
As the aging population grows, understanding these household dynamics is crucial for shaping housing policy, caregiving models, and community-based services.
Source:
Census. America’s Families and Living Arrangements: 2022
Transitions in Family Structure Over Time
Over the past eight decades, the structure of American households has shifted dramatically—moving away from the traditional married-couple model toward a broader range of family and nonfamily living arrangements. These shifts have had a direct impact on how older adults live today.
As shown in the chart below from the U.S. Census Bureau, married households—once the dominant form—have steadily declined from approximately 78% in 1950 to just under 50% in 2024. At the same time, nonfamily households (those consisting of individuals living alone or with unrelated persons) have risen sharply, now making up nearly 40% of all U.S. households.

These long-term shifts reflect a wide range of societal changes, including:
- 🌍 Cultural shifts away from multigenerational coresidency.
- 📉 Delayed marriage and childbearing
- 👩💼 Rising divorce rates and widowhood
- 🧍 Greater independence and solo living, particularly among older women
📈 What Might Happen in the Next 50 Years?
Based on long-term demographic trends and U.S. Census projections, we can reasonably expect the shift away from traditional married-couple households to continue over the next half-century.
Here’s what we anticipate:

- Married-couple households may fall below 40% by 2075.
Given the declining trend from nearly 80% in 1940 to under 50% by 2024, and a fairly stable annual drop of 0.2 to 0.3 percentage points in recent decades, it’s likely that married households will make up less than 40% of all U.S. households sometime between 2070 and 2080—especially as median age continues to rise. - Nonfamily households may reach or exceed 40%.
Nonfamily households (which include people living alone or with nonrelatives) have risen steadily since the 1960s. With aging Baby Boomers, higher rates of lifelong singlehood, and continued urbanization, we project this household type to reach parity with married households by mid-century—and potentially become the majority thereafter. - Multigenerational and “other family” households will likely grow slowly but steadily.
Though still a minority, households involving extended family members are projected to increase gradually. This is backed by data showing rising shares of older adults in co-residence due to economic necessity, caregiving needs, and cultural shifts. The U.S. Census Bureau projects the senior population (65+) to nearly double by 2100—from 56 million in 2022 to over 96 million.
🔍 What This Prediction Is Based On
- Population aging: Median age is projected to rise from 38.9 in 2022 to over 49 by 2100. The share of people aged 65+ will grow from 17% in 2022 to around 26% by 2100, increasing the number of seniors likely to live alone or in alternative arrangements.
- Marriage trends: Historical data shows a consistent and long-term decline in marriage rates, especially among younger adults.
- Fertility & birth rates: Natural population growth (births minus deaths) is projected to turn negative by 2040, suggesting smaller nuclear families and fewer child-centered households.
- Racial and cultural shifts: By 2060, the U.S. will be significantly more racially and culturally diverse, with continued growth in Hispanic and Asian populations—groups that currently exhibit higher rates of multigenerational living.
- Economic pressures: Housing affordability, caregiving burdens, and migration patterns will all play a role in reshaping the American household.
These forecasts are aligned with official projections from the U.S. Census Bureau (2023 population projections, Table 3 and Table 5). You can access the source here:
U.S. Census Bureau 2023 Projections Main Series
Where Seniors Live: State-by-State and Regional Distribution
How Is “Region” Defined in Population Data?
In demographic studies, the U.S. is typically divided into four main Census regions:
—“Northeast”
—“Midwest”
—“South”
—“West”
Some reports also provide state-by-state comparisons or metro area data.
This section follows U.S. Census Bureau definitions to present a consistent view of where seniors live.
Older adults are not evenly distributed across the country—some states and regions attract significantly larger senior populations than others. Senior citizens statistics highlight how factors like climate, affordability, and proximity to family shape where seniors choose to live in 2025.
Geographic Distribution by Region
When analyzing senior citizens statistics, understanding where older adults live is essential for shaping policies, allocating resources, and planning for future needs. The geographic distribution of the 65+ population reveals not only where seniors are most concentrated, but also which states are aging fastest and how likely older adults are to relocate.
🗺️ Where Most Older Adults Live
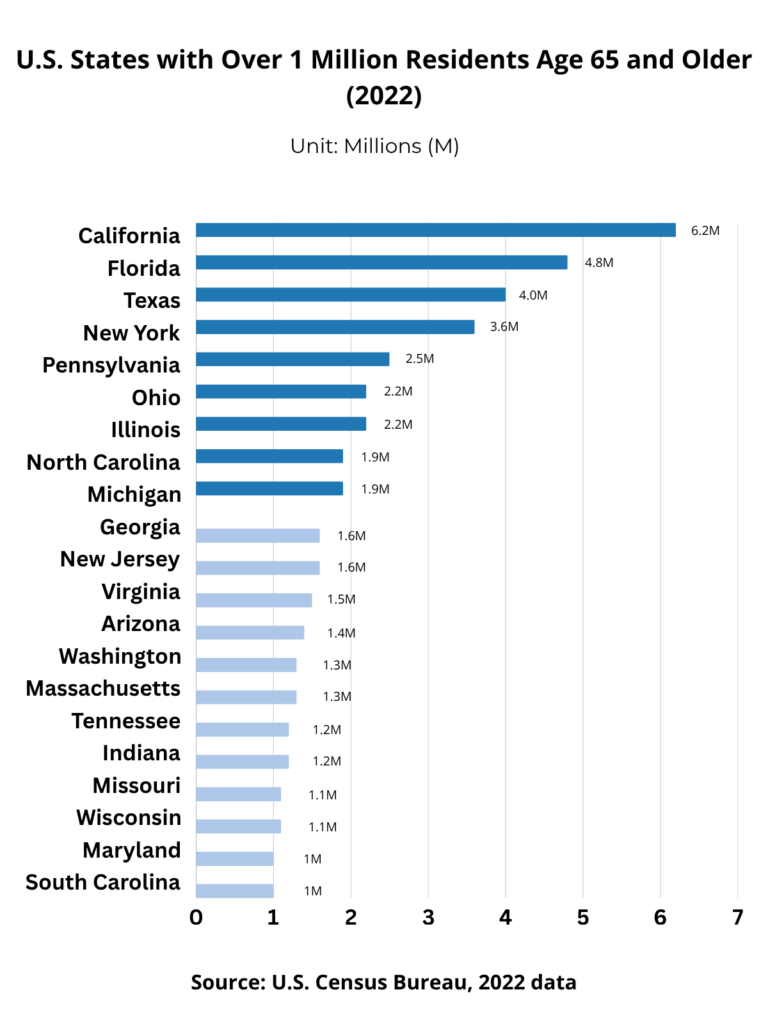
In 2022, half of all Americans aged 65 and older lived in just nine states:
- California (6.2 million)
- Florida (4.8 million)
- Texas (4.0 million)
- New York (3.6 million)
- Pennsylvania (2.5 million)
- Ohio (2.2 million)
- Illinois (2.2 million)
- North Carolina (1.9 million)
- Michigan (1.9 million)
These nine states alone account for a massive share of the nation’s older adult population. Additionally, Georgia, New Jersey, Virginia, Arizona, Washington, Massachusetts, Tennessee, Indiana, Missouri, Wisconsin, Maryland, and South Carolina each had over 1 million residents aged 65 and older in 2022.
Source:
U.S. Census Bureau, 2022 Population Estimates
📈 States with the Highest Share of Seniors
Looking at seniors as a percentage of the total state population, four states lead the nation:
- Maine – 23%
- Florida – 22%
- Vermont – 22%
- West Virginia – 21%
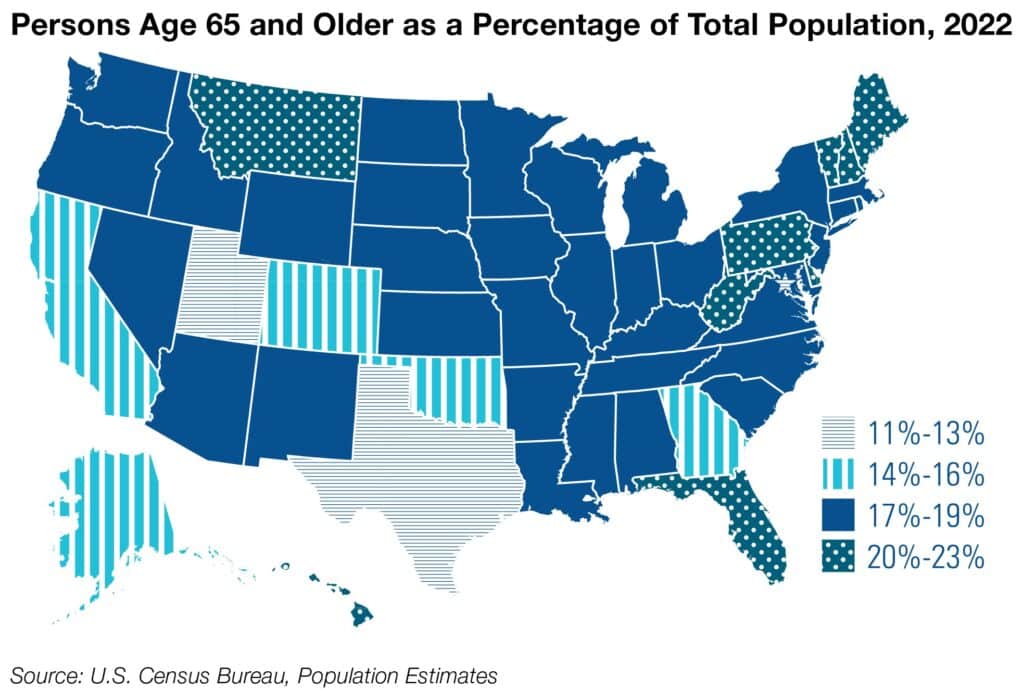
These percentages reflect a combination of factors such as aging-in-place, retirement migration, and lower birth rates—highlighting states where seniors already form a large part of the community fabric.
🔼 Fastest-Growing Senior Populations (2012–2022)
Between 2012 and 2022, some states saw remarkable growth in their older populations. Three states experienced an increase of more than 50% in their 65+ population:
- Alaska – 63%
- Idaho – 55%
- Delaware – 51%

This rapid growth reflects broader demographic shifts, including the aging of the Baby Boomer generation and the rising appeal of new regions for retirees.
Urban vs. Rural Living Patterns
Older adults in the U.S. are unevenly distributed across urban and rural areas, and these patterns have important implications for healthcare access, transportation, and community support. According to recent senior citizens statistics, rural counties often have a higher share of older adults, while urban counties contain a larger number of them.
| Area Type | Total Population (M) | Population Age 65+ (M) | Percentage Age 65+ |
| Rural | 46.1 | 9.4 | 20.3% |
| Urban | 289.6 | 47.4 | 16.4% |
Urban and rural areas in the United States show clear differences in the composition of their senior populations. While urban areas are home to the vast majority of the total population and contain 47.4 million adults aged 65 and older, their seniors represent only 16.4% of the urban population.
In contrast, rural areas, with a much smaller total population, have a higher concentration of seniors, with 20.3% of their residents aged 65 and older. These statistics underscore the more advanced aging profile of rural communities, which has significant implications for healthcare access, transportation, and local support services.
- Urban counties (e.g., Los Angeles County, Cook County) have the highest total numbers of seniors aged 65+, due to their overall large populations.
- Rural and semi-rural counties (especially in states like Florida, Maine, and West Virginia) often have a much higher percentage of older adults, in some cases exceeding 25% of the local population.
- In contrast to younger people, older Americans are far less likely to move—only 3% of seniors moved between 2021 and 2022, compared to 10% of those under 65. Among those who did move, 53% stayed within the same county, reinforcing local aging patterns.
- Healthcare deserts, long travel distances, and fewer public transport options in rural areas can compound the challenges faced by aging populations there, even though community ties may be stronger.
These senior citizens statistics underscore the growing need for place-based aging policies—including mobile healthcare, local community programs, and age-friendly infrastructure in both metropolitan and rural settings.
Source:
U.S. Census Bureau, 2022 American Community Survey 5-Year Estimates.
Migration Patterns Among Seniors
When it comes to relocation, older adults in the U.S. are far less mobile than younger age groups. According to recent senior citizens statistics, only 3% of people aged 65 and older moved between 2021 and 2022, compared to 10% of those under age 65.
Among the seniors who did move:

- 53% stayed within the same county
- 25% moved to a different county within the same state
- 22% moved to a different state or abroad
This pattern reflects a strong tendency for older adults to age in place, remaining in familiar communities and near established support networks. Even when they move, the majority relocate short distances—often within the same region—suggesting that relocation is more often a matter of adjusting housing or proximity to family, rather than major lifestyle change.
Source:
Administration for Community Living, 2023 Profile of Older Americans
Senior Population Growth vs. Overall Population Growth
As the U.S. population ages, it’s important to look beyond where seniors live and examine how their numbers are changing over time. This section compares each state’s senior citizens statistics—specifically the growth in the 65+ population share—with overall population trends.
By viewing both together, we reveal which states are aging the fastest, even if their total population is stable or shrinking.
📈 Top 10 States Where Senior Population Is Growing Fastest—Alongside Overall Population (2010–2023)
| State | 65+ Population Share in 2010 | 65+ Population Share in 2023 | Change in 65+ Share | Total Population in 2010 | Total Population in 2023 | Change in Total Population |
| Vermont | 14.6% | 20.8% | 6.2% | 624,258 | 645,254 | 3.36% |
| Maine | 15.9% | 21.9% | 6.0% | 1,327,665 | 1,377,400 | 3.75% |
| New Hampshire | 13.6% | 19.5% | 5.9% | 1,313,939 | 1,387,834 | 5.62% |
| Alaska | 7.5% | 13.3% | 5.8% | 691,189 | 733,971 | 6.19% |
| Delaware | 14.4% | 20% | 5.6% | 881,278 | 1,005,872 | 14.14% |
| Wyoming | 12.4% | 18% | 5.6% | 545,579 | 579,761 | 6.27% |
| New Mexico | 13.3% | 18.8% | 5.5% | 2,013,122 | 2,114,768 | 5.05% |
| Hawaii | 14.5% | 19.9% | 5.4% | 1,333,591 | 1,445,635 | 8.40% |
| Arizona | 13.8% | 18.6% | 4.8% | 6,246,816 | 7,268,175 | 16.35% |
| South Carolina | 13.7% | 18.5% | 4.8% | 4,511,428 | 5,212,774 | 15.55% |
| Puerto Rico* | 14.70% | 22.70% | 8.0% | 3,762,322 | 3,254,885 | -13.49% |
* Note: Puerto Rico is a U.S. territory, not one of the 50 states. It is listed separately to reflect its unique demographic trends while maintaining consistency in senior citizens statistics across all U.S. jurisdictions.
📉States with Little or Negative Overall Growth but a Rapidly Aging Population (2010–2023)
| State | 65+ Population Share in 2010 | 65+ Population Share in 2023 | Change in 65+ Share | Total Population in 2010 | Total Population in 2023 | Change in Total Population |
| West Virginia | 16.1% | 20.7% | 4.6% | 1,840,802 | 1,784,462 | -3.06% |
| Illinois | 12.6% | 16.6% | 4.0% | 12,745,359 | 12,692,653 | -0.41% |
| Mississippi | 12.9% | 16.8% | 3.9% | 2,941,991 | 2,951,438 | 0.32% |
| Michigan | 13.8% | 18.2% | 4.4% | 9,952,687 | 10,051,595 | 0.99% |
| Connecticut | 14.2% | 18.1% | 3.9% | 3,545,837 | 3,598,348 | 1.48% |
| Ohio | 14.1% | 17.9% | 3.8% | 11,512,431 | 11,780,046 | 2.32% |
| Pennsylvania | 15.5% | 19.1% | 3.6% | 12,612,705 | 12,986,518 | 2.96% |
| Puerto Rico* | 14.70% | 22.70% | 8.0% | 3,762,322 | 3,254,885 | -13.49% |
* Note: Puerto Rico is a U.S. territory, not one of the 50 states. It is listed separately to reflect its unique demographic trends while maintaining consistency in senior citizens statistics across all U.S. jurisdictions.
Senior Health Statistics and Most Common Chronic Conditions
What Are “Chronic Conditions”?
Chronic conditions are long-term health issues that:
—“Last a year or more”
—“Require ongoing medical attention”
—“or limit daily living activities”
Common examples include:
—“Arthritis”
—“Diabetes”
—“Hypertension”
—“Heart disease”
These conditions significantly shape healthcare needs among seniors in the U.S.
Health plays a central role in the quality of life for older Americans, influencing everything from independence to daily routines. Senior citizens statistics shed light on the most common chronic conditions affecting this population in 2025, offering insight into their healthcare needs and challenges.
Prevalence of Chronic Conditions Among Seniors
As people age, chronic health conditions become increasingly common—and often unavoidable. Among Americans aged 65 and older, the vast majority live with at least one chronic illness, and many experience several at once. These conditions not only affect quality of life but also drive healthcare needs and costs.
According to the 2023 Profile of Older Americans, published by the U.S. Administration for Community Living, the most prevalent chronic conditions among seniors in 2022 were:
| Chronic Condition | Prevalence (%) |
|---|---|
| Diagnosed Hypertension (High Blood Pressure) | 59% |
| High Cholesterol (Hyperlipidemia) | 48% |
| Arthritis | 48% |
| Any Type of Cancer (Diagnosed) | 26% |
| Diagnosed Diabetes | 20% |
| Coronary Heart Disease | 15% |
| Chronic Obstructive Pulmonary Disease (COPD, etc.) | 10% |
| Myocardial Infarction (Heart Attack) | 8% |
| Angina (Chest Pain Due to Reduced Blood Flow to the Heart) | 5% |

These figures highlight the health burden carried by older Americans. Conditions such as hypertension, arthritis, and high cholesterol affect nearly half or more of the senior population. Additionally, 26% of older adults have been diagnosed with some form of cancer, and 1 in 5 are managing diabetes.
Many older adults also experience multimorbidity, which means they are managing two or more chronic conditions simultaneously. This makes care coordination more complex and increases the likelihood of hospitalizations, functional decline, and reduced independence.
Understanding the prevalence of these conditions is crucial for caregivers, policymakers, and healthcare providers who support aging populations. Preventive care, lifestyle adjustments, and access to effective medical management can help improve outcomes and maintain quality of life.
Source:
Administration for Community Living. 2023 Profile of Older Americans (Published May 2024).
Health Status by Age and Gender
As people age, overall health status tends to decline—a trend well supported by national data. According to the CDC’s National Health Interview Survey (NHIS), 24.3% of U.S. adults aged 65 and older rated their health as “fair” or “poor” in 2023, compared to 19.4% among adults aged 50–64, and just 7.6% among those aged 18–34.

Older adults are more than three times as likely to report poor health as young adults.
This decline in self-rated health with age reflects a lifetime of accumulated health risks, chronic conditions, and functional limitations. While advances in medical care have extended life expectancy, they have not necessarily eliminated the burden of disease and disability in later years.
📊 Gender Differences in Health Perception
Across all age groups, women are more likely than men to report fair or poor health. In 2023, 15.6% of women rated their health as fair or poor, compared to 14.7% of men. Though the difference may appear small, it has been consistent across years of survey data.
Several factors may contribute to this gender gap:
- Women live longer on average, making them more likely to accumulate age-related health issues.
- Women are also more likely to experience arthritis, osteoporosis, and depression—all of which impact perceived health status.
- In contrast, men are more likely to underreport health problems.
💼 Missed Work and Functional Impact
Another way to understand health status is through its impact on daily functioning. One NHIS indicator tracks the percentage of adults who missed six or more workdays in the past year due to illness, injury, or disability.
In 2023:
- 13.9% of adults aged 65+ reported missing six or more days, up from 9.9% in 2019.
- By gender, 17.1% of women reported six or more missed workdays, compared to 13.8% of men.
This measure highlights not just the presence of health conditions, but their tangible effects on everyday life—especially among women, who consistently report higher levels of functional limitation.

Older Americans face greater health challenges as they age, and women—despite living longer—are more likely to experience and report poorer health and greater day-to-day limitations. These differences underscore the importance of designing healthcare interventions that are responsive to both age and gender.
Source:
CDC, National Health Interview Survey 2023
Self-Reported Health and Functional Limitations
📊 General Self-Rated Health Status Among Older Adults
According to the 2023 National Health Interview Survey (NHIS), the majority of U.S. adults aged 65 and older rated their health as either “excellent,” “very good,” or “good”:

- 76.6% of seniors aged 65+ reported good or better health
- 23.4% rated their health as “fair” or “poor”
- For comparison, only 10.1% of adults aged 18–44 reported “fair” or “poor” health
Self-rated health tends to decline with age, especially among those aged 75 and older, and shows strong correlations with chronic illness, disability, and mortality risk.
Source:
CDC, NHIS Interactive Data Query Systems 2023
🚶♂️ Difficulties with Basic Physical Functions
Age-related physical limitations become more common as people grow older. According to 2023 federal data, a significant share of Americans aged 65 and older report challenges in performing basic physical functions such as walking, hearing, seeing, and self-care.
Here’s a breakdown of the percentages of older adults (65+) who reported difficulty in the following areas in 2023:

- Walking or climbing steps: 40.5%
- Hearing (any difficulty): 30.5%
- Seeing (any difficulty, even when wearing glasses): 23.1%
- Remembering or concentrating: 29.8%
- Communicating (e.g., being understood): 9.3%
- Self-care (e.g., bathing or dressing): 9.0%
- Any disability (defined as having at least one of the above difficulties): 18.3%
These figures highlight that while many older adults remain active and independent, a substantial proportion experience physical or cognitive limitations that may impact daily functioning and independence.
Source:
CDC, NHIS Interactive Data Query Systems 2023
⚖️Gender and Racial Disparities
Senior citizens statistics reveal clear gender and racial disparities in functional limitations among older adults in the United States. While aging affects all individuals, the extent and severity of physical and cognitive challenges differ significantly based on demographic background.
Based on data from the CDC’s National Health Interview Survey (2019):
📌 By Gender (Ages 65 and Over)
Severe limitations (“a lot of difficulty” or “cannot do at all”):
- Women: 20.4%
- Men: 17.9%
Moderate limitations (“some difficulty”):
- Women: 46.0%
- Men: 47.8%
Although moderate limitations are common for both genders, women are more likely than men to experience severe functional challenges in later life.
📌 By Race and Ethnicity (Ages 65 and Over)

Severe limitations (“a lot of difficulty” or “cannot do at all”):
- American Indian or Alaska Native: 37.4%
- Two or more races: 28.3%
- Hispanic or Latino: 24.5%
- Black or African American only: 20.7%
- White only: 19.0%
- Asian only: 10.9%
Moderate limitations (“some difficulty”):
- American Indian or Alaska Native: 38.5%
- Two or more races: 49.7%
- Hispanic or Latino: 38.4%
- Black or African American: 44.6%
- White only: 47.7%
- Asian only: 42.4%
Functional difficulties—both moderate and severe—are disproportionately higher among Native American, Hispanic, and multiracial seniors. Asian older adults consistently report the lowest limitation rates across both severity levels.
These disparities reflect differences in lifetime access to healthcare, socioeconomic status, occupational exposure, and chronic disease prevalence.
Income-based disparities are equally significant: seniors living below the poverty line are over three times as likely to report severe functional limitations as those in the highest income brackets.
Source:
CDC National Center for Health Statistics – Table FxLimit (2019)
Out-of-Pocket Health Costs Have Risen Sharply Since 2012
One of the most striking senior citizens statistics over the past decade is the sharp rise in out-of-pocket healthcare spending among older adults. As healthcare needs increase with age, so too does the financial burden placed on seniors and their families.
According to the 2023 Profile of Older Americans, adults aged 65 and older incurred average out-of-pocket healthcare expenses of $7,540 in 2022—a 47% increase from $5,118 in 2012.
These costs are significantly higher than those of the general population, which averaged $5,850 in out-of-pocket health spending. In terms of overall budgets, older adults spent 13% of their total expenditures on health care, compared to 8% among all consumers.
Breakdown of seniors’ average health costs in 2022:
- $5,277 (70%) for insurance
- $1,142 (15%) for medical services
- $843 (11%) for prescription drugs
- $278 (4%) for medical supplies
As the aging population grows, these rising expenses highlight the importance of financial planning, accessible insurance options, and support for affordable care.
Source:
Administration for Community Living (ACL). 2023 Profile of Older Americans
As senior citizens statistics reveal, chronic health conditions, functional limitations, and rising healthcare costs are all part of the complex realities many older adults face. These challenges underscore the essential role of accessible, affordable, and consistent medical care in ensuring seniors can manage their health and maintain quality of life.
Understanding how older Americans access healthcare—particularly through Medicare and other insurance options—is key to identifying where gaps remain and what support systems are most needed as the senior population continues to grow.
Access to Healthcare and Medicare Coverage for Seniors
Access to affordable, reliable healthcare is essential for maintaining well-being in later life. Senior citizens statistics reveal how coverage through Medicare and other programs shapes the healthcare experiences of older adults in 2025, from routine visits to managing long-term conditions.
Medicare Enrollment and Coverage Types
Senior citizens statistics from 2022 show that older adults in the U.S. have near-universal access to some form of health insurance. Here’s a breakdown of coverage types among adults aged 65 and over, based on federal survey data:

- All types coverage – 99%
Nearly all seniors—99%—had health insurance from at least one source in 2022. This reflects both the effectiveness of Medicare enrollment and the use of supplemental coverage to fill care gaps. - Total private – 46%
Almost half of seniors had private insurance in addition to public coverage like Medicare. This often includes employer-sponsored or individually purchased plans.- Employment-based – 23%
About one in four seniors continued to receive coverage through a current or former employer, especially those who retired from jobs with health benefits. - Direct purchase – 20%
One in five older adults bought health plans directly, such as Medigap (Medicare Supplement), Medicare Advantage (Part C), or marketplace plans to cover services not included in traditional Medicare.
- Employment-based – 23%
- Total government – 94%
A large majority of seniors were covered through public insurance programs.- Medicare – 94%
Medicare remains the core source of coverage for nearly all adults aged 65 and older, providing access to hospital and medical services. - Medicaid – 7%
A smaller share of seniors—particularly those with limited income—qualified for Medicaid, either as dual-eligibles or through long-term care coverage. - Military – 6%
About 6% of seniors received insurance through military-related programs such as TRICARE, CHAMPVA, or the Department of Veterans Affairs.
- Medicare – 94%
- Not covered – 1%
Only 1% of seniors lacked any health insurance, highlighting near-universal coverage in this age group.
This layered system reflects the complexity of healthcare coverage for older adults, many of whom rely on multiple programs to meet their evolving medical needs and financial circumstances.
Source:
Administration for Community Living (ACL). 2023 Profile of Older Americans
Utilization of Healthcare Services
Senior citizens statistics highlight how frequently older adults rely on healthcare services to manage chronic conditions, functional limitations, and preventive care needs. According to the 2023 Profile of Older Americans:
- 96% of adults aged 65 and older reported they had a usual place to go for medical care, such as a primary care clinic or doctor’s office.
- 71% received an influenza vaccination in the past 12 months.
- 64% reported they had ever received a pneumococcal vaccination, which helps prevent pneumonia and other related infections.
- 23% of seniors had a hospital emergency department visit in the past year.
- 3% said they did not obtain needed medical care due to cost, indicating that while Medicare covers most acute needs, financial barriers still exist for a small share of seniors.
These numbers show that while access to basic and preventive care is strong among seniors, the relatively high rate of emergency department visits underscores the need for better chronic disease management and community-based support to reduce avoidable hospitalizations.
Source:
Administration for Community Living (ACL). 2023 Profile of Older Americans
Barriers to Accessing Healthcare
While Medicare and Medicaid have expanded coverage for millions of older Americans, gaps in access to quality care still persist.
Recent senior citizens statistics reveal that many seniors continue to face challenges such as financial strain, for example, the rising costs shown in how much do seniors pay for healthcare services; limited transportation, provider shortages, digital literacy gaps, and cultural or language barriers.
These obstacles often work together, making it harder for vulnerable older adults—especially those in rural areas or with low incomes—to receive timely and affordable healthcare.
💰 Financial Constraints Beyond Medicare Coverage
Although Medicare provides nearly universal health insurance for adults 65 and older, it does not fully cover essential services like dental care, vision exams, hearing aids, or long-term care. As a result, older adults still face substantial out-of-pocket expenses.
According to the 2023 Profile of Older Americans, consumers age 65+ incurred an average of $7,540 in out-of-pocket healthcare costs in 2022—an increase of 47% compared to 2012. Health expenses now account for 13% of seniors’ total spending, far higher than the 8% for the general population.

While 94% of older adults have Medicare coverage, the report highlights that seniors still need to pay about half of their total health spending from other sources such as private insurance, savings, or supplemental plans. This is especially challenging for those with limited incomes—the median income for older individuals in 2022 was just $29,740.

Moreover, economic insecurity amplifies these barriers. In 2022, 5.9 million older Americans lived below the poverty level, and another 2.7 million were classified as near-poor, meaning even small medical bills can force them to delay or skip necessary care.
As a result, many seniors are left making difficult trade-offs—choosing between paying for healthcare, housing, or basic living expenses, which ultimately undermines their health and quality of life.
Source:
Administration for Community Living (ACL). 2023 Profile of Older Americans
🚌 Transportation and Geographic Isolation
Reliable transportation is more than a convenience for older adults—it is a lifeline to healthcare, social connections, and independence. Yet many seniors, especially those in rural areas or with limited incomes, face significant transportation barriers that lead to missed medical appointments, delayed treatments, and worsening health outcomes.
According to the CDC’s National Health Interview Survey, 5.7% of U.S. adults lacked reliable transportation for daily living in 2022, with the rate slightly lower among older adults aged 65+ (4.5%) compared to younger age groups. However, this percentage is far higher for low-income households—15.8% among adults living below the poverty line—and for certain racial groups, such as Black adults (9.2%) and American Indian/Alaska Native adults (17.1%).

For seniors, the consequences of transportation barriers are profound. Research by the Urban Institute found that adults without household vehicle access who live in neighborhoods with poor public transit are more than twice as likely to forgo needed medical care—21% versus 9% in areas with better transit options.
These challenges are magnified in rural communities, where nearly 25% of older Americans live, often 20+ miles from the nearest hospital, making them 50% more likely to miss appointments compared to urban seniors.
Missed medical visits create a ripple effect: seniors with unreliable transportation are 2–3 times more likely to experience complications from chronic conditions, skip preventive screenings, and end up in emergency rooms for preventable issues. A report cited by H&M Transport estimates that transportation-related care delays cost the U.S. healthcare system $19 billion annually in avoidable hospitalizations.
The impact isn’t only medical—transportation barriers drive social isolation, which raises the risk of depression, cognitive decline, and even mortality. Studies show that transportation-limited seniors reduce their social activities by 65%, leading to a 50% higher risk of dementia and a 29% higher risk of heart disease compared to their more mobile peers.
These senior citizens statistics highlight that transportation is a critical social determinant of health. For America’s aging population—projected to reach 80 million adults 65+ by 2040—addressing geographic isolation and mobility challenges will be essential to ensuring equitable healthcare access, reducing preventable costs, and supporting healthy aging.
Source:
Urban Institute. More than One in Five Adults with Limited Public Transit Access Forgo Health Care Because of Transportation Barriers.
H&M Transport. How Transportation Barriers Impact Senior Health Outcomes
👩⚕️ Healthcare Provider Shortages
As the U.S. population ages, the demand for healthcare services is outpacing the supply of qualified providers—creating a looming crisis for seniors. Recent senior citizens statistics indicate that by 2030 the number of Americans aged 65+ will grow by 55%, and by 2050 it will reach 82 million, up 47% from 2022 levels.
Older adults typically require two to three times more medical services than younger patients, particularly in specialty care, but the healthcare workforce is not growing fast enough to meet this demand.
According to the Association of American Medical Colleges (AAMC), the U.S. faces a projected shortage of 40,800–104,900 physicians by 2030, including a shortfall of 7,300–43,100 primary care physicians and 33,500–61,800 non-primary care specialists.
Population aging is the primary driver of this increasing demand—physicians over age 65 already make up 17% of the current workforce, and another 25% are between 55 and 64, meaning over a third could retire within the next decade.
The shortage is even more severe in geriatrics, the specialty most directly focused on seniors. The American Geriatrics Society projects that the U.S. will need 30,000 geriatricians by 2030 to care for about 21 million vulnerable older adults. Yet the total number of board-certified geriatricians has declined to about 7,400 in 2022, down from around 10,000 at the start of the century.
This means that to meet the need, the country would have to train around 1,600 geriatricians every year until 2030—a goal that current training programs are far from reaching.

These shortages have already begun to affect care access and quality. Wait times for physician appointments have risen to 26 days on average, and in some geriatric practices, patients face six-month waiting lists. In nursing homes, 72% reported having fewer staff in 2024 than before the pandemic, leading 57% to maintain waiting lists and 46% to limit intake of residents.

Without immediate action—such as expanding residency slots, offering incentives for geriatric specialization, and supporting team-based care—these shortages will lead to longer wait times, fragmented care, more preventable hospitalizations, and worse outcomes for seniors who rely on timely, coordinated care.
Source:
aamc.org. The Complexities of Physician Supply and Demand: Projections from 2021 to 2036
healthmanagement.org. Physician Shortage Could Hit 100K by 2030
pensionpolicyinternational.com. America’s aging population faces a growing shortage of geriatric care
americangeriatrics.org. The American Geriatrics Society Projected Future Need for Geriatricians
💻 Digital Divide in Telehealth Adoption
Telehealth has the potential to bridge healthcare gaps for millions of seniors, but the digital divide continues to limit its reach. While senior citizens statistics show that technology adoption among older adults has grown rapidly in recent years—especially during the COVID-19 pandemic—significant barriers remain in access, affordability, and digital literacy.
According to Pew Research Center, 67% of adults aged 65 and older now go online, a dramatic 55‑percentage‑point increase over the past two decades. Yet one-third of seniors still never use the internet, and 49% lack home broadband altogether.
Even among those connected, usage varies sharply by age and income: 82% of 65–69‑year‑olds go online, compared to only 44% of those 80 and older; meanwhile, 87% of high‑income seniors have broadband at home, compared to just 27% of those living on less than $30,000 a year.

The pandemic accelerated older adults’ reliance on technology for healthcare. AARP reports that telehealth visits via smartphones jumped from 28% before the pandemic to 40% after, and 70% of older adults used video chat for the first time, with one in three using it weekly. However, these gains are uneven: 15% of adults 50+ have no internet access, and 60% cite the cost of high‑speed internet as a barrier.

Digital skills and confidence remain another major challenge. Only 26% of senior internet users feel “very confident” using devices, while nearly half (48%) say they need someone else to set up or teach them how to use new technology. Privacy concerns further discourage adoption—34% of seniors worry about online safety.
This digital divide among older adults means that many of the very seniors who could benefit most from telehealth—particularly those who are older, lower‑income, or living in rural areas—are the least likely to access it.
Without targeted efforts to improve broadband affordability, expand digital literacy training, and build senior‑friendly telehealth platforms, the promise of telemedicine will remain out of reach for millions of aging Americans.
Source:
Pew Research Center. Tech Adoption Climbs Among Older Adults. 2017, updated 2022.
AARP. Tech Usage Among Older Adults Skyrockets During Pandemic. 2021.
🌍 Cultural, Linguistic, and Trust Barriers
As the U.S. senior population becomes increasingly diverse, cultural and linguistic barriers are emerging as critical obstacles to equitable healthcare access.
According to senior citizens statistics, by 2030 nearly one in five Americans will be 65 or older, and 28% of seniors will be from racial or ethnic minority groups, up from 18% in 2010. By 2060, non‑Hispanic White seniors will comprise less than half of the older population, while Hispanic, Asian, and multiracial older adults will see the largest growth.

This demographic shift highlights the growing importance of culturally and linguistically appropriate care. Yet, minority seniors still experience significant disparities. Before age 65, Hispanic and Black adults were 4–9 percentage points less likely than White adults to receive preventive services such as routine check-ups, blood pressure screenings, and cancer screenings.
While Medicare eligibility at 65 narrowed some gaps, research shows it did not completely eliminate racial and ethnic disparities, underscoring that insurance alone cannot overcome deeper cultural and trust barriers.
Language remains one of the most persistent challenges. Seniors with limited English proficiency (LEP) are far less likely to access healthcare—even after adjusting for income and insurance coverage. A national analysis found that LEP patients were underrepresented in 26 of 28 medical specialties, with the greatest disparities in pulmonology (only 26% of visits compared to English-proficient peers), orthopedics (35%), and psychiatry (43%). Even in primary care, LEP patients had 24% fewer visits than English speakers.
Another study confirmed that adults with LEP were twice as likely to lack a usual source of care (aOR = 2.48) and twice as likely to miss preventive services like blood pressure checks (aOR = 2.00) and colorectal cancer screenings (aOR = 1.58). These findings were consistent even among seniors eligible for Medicare, showing that language barriers independently contribute to delayed care and poorer outcomes.
Compounding the problem is low health literacy, which disproportionately affects older adults, immigrants, and those with limited education. The National Assessment of Adult Literacy found that 36% of Americans—and nearly half of those 65+—have only “basic” or “below basic” health literacy, making it harder to understand medical instructions, navigate insurance paperwork, or manage chronic conditions. Seniors with low health literacy are more likely to misuse medications, skip screenings, and be hospitalized for preventable conditions.
For aging immigrant populations, trust adds yet another layer. Many older immigrants are ineligible for Medicare because they lack the required 10 years of Social Security contributions. Even documented immigrants who qualify may be reluctant to use services due to unfamiliarity with the U.S. healthcare system. Studies show that 23% of documented immigrants and 45% of undocumented immigrants are uninsured, compared to just 9% of U.S. citizens. Fear of immigration enforcement, language barriers, and historical exclusion often lead to underuse of available healthcare, even when services are technically accessible.
Cultural norms can also influence care-seeking behavior. In some collectivist cultures, seniors may delay professional care and rely on family caregiving, while others view mental health services as stigmatizing. Without culturally competent care and language-concordant communication, minority seniors are at higher risk of misdiagnosis, medication errors, and avoidable hospitalizations.
Bridging these gaps requires system-level interventions, including:
- Expanding interpreter services and hiring bilingual healthcare staff
- Training providers in cultural competence and trust-building
- Offering plain-language educational materials tailored to seniors’ literacy levels
- Partnering with community organizations to build familiarity and trust
- Reforming policies to ensure aging immigrants have equitable access to care
Without these measures, cultural, linguistic, and trust-related barriers will continue to deny millions of older adults—particularly minority and immigrant seniors—timely, high-quality care, deepening existing health inequities.
Source:
U.S. Census Bureau. Demographic Turning Points for the United States: 2020-2060
sciencedirect.com. Changes in preventive service use by race and ethnicity after medicare eligibility in the United States
link.springer.com. Specialty Care Utilization Among Adults with Limited English Proficiency
link.springer.com. Access to Care Among Adults with Limited English Proficiency
wikipedia.org. Health literacy
axios.com. Health care has few plans to address the aging immigrant population
Trends in Medicare Spending and Policy Changes
As the U.S. population ages, Medicare—the primary health coverage for older adults—faces rising financial pressures.
According to recent senior citizens statistics, national health spending grew 7.5% to $4.9 trillion in 2023, accounting for 17.6% of GDP. Medicare alone increased 8.1% to $1.03 trillion, or 21% of total health expenditures, and is projected to keep outpacing economic growth through 2033. These spending trends and policy shifts are reshaping how seniors access and afford care, underscoring the need for sustainable reforms.
📈 Rising Medicare Spending Amid an Aging Population
Medicare spending has accelerated in response to demographic shifts and greater demand for care among older adults. In 2023, per-capita personal health care spending for people aged 65 and older reached $22,356, which is over five times higher than spending per child ($4,217) and 2.5 times higher than spending for working-age adults ($9,154).
While older adults made up just 17% of the population, they accounted for 37% of all personal health care spending in 2020, underscoring how aging drives a disproportionate share of health costs.
Nationally, Medicare expenditures have also grown in specific care categories. Hospital spending increased 10.4% in 2023, while prescription drug costs jumped 11.4%, outpacing the 7.8% growth recorded in 2022. Physician and clinical services grew 7.4% in 2023. Over the next decade (2024–2033), NHE is projected to grow 5.8% annually, faster than the projected 4.3% GDP growth, pushing health spending’s share of GDP from 17.6% in 2023 to 20.3% in 2033.
The rising costs reflect longer life expectancy, higher rates of chronic conditions, and the increasing use of advanced treatments and specialty drugs. As Medicare enrollment climbs—projected to exceed 80 million beneficiaries by 2035—the program faces mounting pressure to balance expanding coverage with long-term financial sustainability.
Source:
cms.gov. NHE Fact Sheet
⚖️ Key Policy Changes Shaping Medicare
Recent policy shifts are reshaping how Medicare delivers and finances care, aiming to improve affordability while addressing long-term sustainability challenges. One of the most significant reforms is the Inflation Reduction Act (IRA) of 2022, which introduces Medicare drug price negotiations and redesigns Part D prescription drug coverage.
Beginning in 2025, IRA provisions will place annual caps on beneficiaries’ out-of-pocket drug costs and gradually expand negotiated price controls through 2031, reducing federal spending on high-cost specialty medications.
Pandemic-era policies have also started to unwind. Temporary waivers, such as the suspension of the three-day hospital stay requirement for skilled nursing facility (SNF) coverage, have expired. This has shifted utilization and spending back toward pre-pandemic patterns, increasing hospital and SNF cost growth projections.
At the same time, expanded telehealth coverage, initially introduced as an emergency measure, has been extended through 2025, maintaining broader access for rural and homebound seniors.
Payment systems for providers are also undergoing changes. Under the Medicare Access and CHIP Reauthorization Act (MACRA), bonus payments and subsidies for alternative payment models are scheduled to phase out by 2026, raising concerns about future physician payment rates and access to care. Meanwhile, Medicare Advantage (MA) policies continue to evolve. Recent rules exclude medical education costs from MA benchmark calculations and update risk adjustment models, which may affect plan bids and payments over time.
In addition, recent appropriations legislation has included targeted updates to Medicare’s payment formulas, such as extending geographic payment adjustments for physicians, revising laboratory reimbursement rules, and replenishing the Medicare Improvement Fund.
While these individual changes may appear incremental, together they signal a shift toward value-based care, cost containment, and more predictable out-of-pocket expenses for seniors.
👵 What These Changes Mean for Seniors
Recent Medicare reforms are reshaping how older adults access and afford care, delivering both immediate savings and raising new challenges for the future.
💊 Major savings on prescription drug costs
Thanks to the Inflation Reduction Act (IRA), Medicare Part D enrollees now have a cap on out‑of‑pocket costs for the first time. In 2024, more than 500,000 beneficiaries who did not qualify for the Low-Income Subsidy hit the catastrophic spending cap, saving a total of $979 million, or about $1,802 per person in just the first six months.
In 2025, this cap will drop to a uniform $2,000 limit, expected to benefit over a million additional seniors, especially those managing chronic conditions like cancer, rheumatoid arthritis, and diabetes. IRA provisions also capped insulin copays at $35/month and eliminated cost-sharing for key adult vaccines.
Looking ahead, Medicare will begin negotiating prices for the first 10 high-cost drugs in 2026, with expected savings of $6 billion for the program and $1.5 billion for beneficiaries in that year alone.
📞 Telehealth remains a vital lifeline, but its future is uncertain
More than 1 in 10 traditional Medicare beneficiaries still used telehealth services in 2023, a sharp drop from the pandemic peak but still a crucial option for rural seniors, those with mobility challenges, or weakened immune systems.
Telehealth provides access to specialists, reduces travel time, and supports independence. While Congress has extended telehealth flexibilities several times, most provisions are set to expire unless lawmakers act.
Behavioral telehealth coverage is permanent, but other virtual services face ongoing political debate, leaving many seniors unsure if these convenient care options will remain available long-term.
🏥 More choices through Medicare Advantage (MA) but with mixed outcomes
By 2024, 54% of Medicare beneficiaries—about 33 million seniors—are enrolled in MA plans, which now account for more than half of federal Medicare spending. Three-quarters of MA enrollees pay no additional premium beyond the standard Part B premium, and many enjoy extra benefits like vision, hearing, and dental coverage.
However, shifting more seniors into private plans has raised questions about payment rates and long-term program costs, with recent benchmark and risk adjustment changes expected to impact plan payments over time.
⚠️ Sustainability challenges could still affect future benefits
Despite these reforms, Medicare’s Hospital Insurance Trust Fund is projected to become insolvent around 2031–2033. Without additional policy changes, future seniors could face higher taxes, increased cost-sharing, or reduced benefits.
Meanwhile, awareness of upcoming reforms remains low—87% of surveyed Medicare beneficiaries had not heard about the 2025 drug cap reforms, even though more than half believe the changes will personally help them.
For today’s seniors, these reforms promise significant financial relief and greater flexibility. But they also highlight the need for clear education, stronger outreach, and further reforms to ensure that Medicare remains both affordable and sustainable for the next generation.
Source:
medicareadvocacy.org. Understanding the Changes in Medicare Part D for 2025
aspe.hhs.gov. Medicare Part D Enrollees Reaching the Out-of-Pocket Limit by June 2024
businessinsider.com. Over a million boomers on Medicare could save big on prescription drugs next year
axios.com. Telehealth advocates turn up the pressure as Medicare deadline nears
Disparities in Healthcare Access by Race or Region
According to the latest senior citizens statistics, access to quality health care for older adults in the U.S. is shaped not only by age but also by race, ethnicity, geography, and socioeconomic status. While Medicare provides near-universal insurance coverage for people ages 65 and older, significant disparities persist.
Black, Hispanic, Asian, and Native American seniors often experience worse health outcomes, face more barriers to culturally appropriate care, and are more likely to live in regions known as “medical deserts.” Rural seniors and those in low-income urban neighborhoods also encounter fewer health care resources, leading to higher rates of preventable chronic conditions, delayed treatment, and avoidable hospitalizations.
🧑🏾⚕️ Racial Disparities in Health Status and Care Experiences
Even with Medicare coverage, older adults of color are more likely to report worse health, higher chronic disease prevalence, and more negative health care experiences compared to White seniors.
✅ Chronic conditions and health status gaps
- Among Medicare beneficiaries with diabetes (2015–2019), 16.7% experienced myocardial infarction (MI), 13.7% had strokes, and 12.5% developed heart failure.
- Black seniors had 30% higher heart failure prevalence (APR=1.30) than White seniors, while Hispanic seniors had lower stroke and heart failure rates compared to both White and Black peers
✅ Discrimination and unfair treatment
- In the past three years, 11% of Black seniors reported being treated unfairly or disrespectfully by a provider due to race/ethnicity, compared to 5% of Hispanic/Asian seniors and just 1% of White seniors.
- Half of Black seniors (50%) and 39% of Hispanic seniors adopt “vigilant behaviors,” such as preparing for possible insults or carefully managing their appearance to avoid unfair treatment, compared to just 25% of White seniors.
✅ Communication and cultural concordance
- White seniors (93%) were more likely to say providers “explained things clearly” compared to Hispanic (85%) and Asian (83%) seniors.
- Decision-making involvement was also lower for Hispanic (75%) and Asian (66%) seniors compared to White (87%) seniors.
- Only 36% of Black seniors said at least half of their visits were with racially concordant providers, while 74% of White seniors had this experience.
🏥 Regional Disparities: Rural vs. Urban “Medical Deserts”
Geography further amplifies health care inequities among older adults.
✅ Rural medical deserts disproportionately affect older adults
- Nearly 80% of rural counties are federally designated as medically underserved, with only 5.1 primary care doctors per 10,000 residents versus 8.0 in urban areas.
- Rural areas have a higher share of adults ages 65+ (17.5% vs. 13.8% in urban areas), meaning closures of 136 rural hospitals (2010–2021) disproportionately affect older populations.
✅ Urban trauma care deserts in minority communities
- In Los Angeles, 89% of Black-majority neighborhoods are located more than five miles from a trauma center, compared to wealthier White areas with closer emergency access. Similar patterns exist in Chicago (73%) and New York City (14%).
✅ Native American seniors in remote regions
- Native American life expectancy is only 73 years, five years lower than the U.S. average, due to chronic underfunding of the Indian Health Service (IHS), outdated facilities, and limited emergency care access.
📄 Socioeconomic and Insurance Disparities
✅ Income and supplemental coverage gaps
- Over 50% of Black and Hispanic seniors live on household incomes below $40,000, compared to 29% of White seniors.
- White seniors are more likely to have private Medigap or employer-sponsored retiree plans, while Black and Hispanic seniors rely more on Medicaid or lower-rated Medicare Advantage plans.
✅ Affordability of care
- In the past year, 16% of Black seniors and 14% of Hispanic seniors reported problems paying for health care, compared to 8% of White seniors.
📜 Policy Insights: Medicare Helps But Doesn’t Erase Gaps
✅ Positive impact of Medicare eligibility at age 65
- Accessing Medicare at 65 significantly increased insurance coverage for Black and Hispanic adults and reduced reports of poor health and poor access to care.
- However, disparities persisted in health outcomes, highlighting the role of broader social determinants like income, housing, and neighborhood resources.
✅ Future policy directions
- Lowering the Medicare eligibility age (e.g., to 60) and expanding benefits (dental, hearing, vision) could further reduce inequities.
- Investing in rural and low-income urban health infrastructure, improving cultural competence training for providers, and expanding telehealth services are key strategies to address gaps.
Source:
cdc.gov. Disparities in Cardiovascular Disease Prevalence by Race and Ethnicity, Socioeconomic Status, Urbanicity, and Social Determinants of Health Among Medicare Beneficiaries With Diabetes
kff.org. Five Facts About Older Adults’ Health Care Experiences by Race and Ethnicity
kff.org. Racial and Ethnic Health Inequities and Medicare
wikipedia.org. Medical deserts in the United States
axios.com. Study: Expanding Medicare eligibility may shrink racial disparities
While Medicare has significantly improved health insurance coverage for older adults, senior citizens statistics reveal that racial, geographic, and socioeconomic disparities still persist in both access and quality of care.
Seniors of color experience higher chronic disease burdens, more barriers to culturally appropriate communication, and a greater likelihood of living in underserved “medical deserts.” Rural residents face hospital closures and provider shortages, while urban minority communities lack equitable trauma and specialist care.
Although policy interventions like lowering the Medicare eligibility age or expanding benefits may reduce gaps, broader systemic issues such as income inequality, social determinants of health, and provider cultural competence must also be addressed to ensure equitable health care for all seniors.
Next, we’ll explore how these health care challenges intersect with mental health, social isolation, and the emotional well-being of older adults.
Mental Health, Loneliness, and Emotional Well-Being of Older Adults
Emotional well-being is just as important as physical health in older age, yet often receives less attention. Senior citizens statistics highlight the growing concerns around loneliness, depression, and mental health challenges among older adults in 2025, underscoring the need for stronger social and emotional support.
Prevalence of Mental Health Conditions Among Seniors
Mental health conditions affect a significant portion of the aging population, yet they remain widely underrecognized and undertreated. According to the World Health Organization (WHO, 2023):
- About 14% of adults aged 60 and older live with a mental disorder, most commonly depression and anxiety.
- These conditions account for 10.6% of the total disability (DALYs) in this age group.
- Globally, over a quarter (27.2%) of all suicide deaths occur among people aged 60 and above.
Older adults are particularly vulnerable due to cumulative life stressors, such as bereavement, chronic illnesses, declining mobility, and reduced income or sense of purpose after retirement. Loneliness and social isolation affect roughly one in four older adults, significantly increasing the risk of depression and anxiety.
In addition, one in six older adults experiences abuse, often by their own caregivers, which can lead to long-term psychological trauma. Ageism and lack of accessible mental health services further compound the problem, leaving many without adequate support.
Why this matters:
Untreated mental health conditions in later life worsen overall health outcomes, increase disability, and contribute to higher mortality. Early detection, social connection, and community-based care are essential to improving seniors’ emotional well-being.
Source:
WHO. Mental health of older adults
Rates and Impact of Loneliness and Social Isolation
Loneliness and social isolation are among the most critical risk factors for poor mental and physical health in later life. While they are related, they are not the same:
- Loneliness is the subjective feeling of being alone, regardless of the actual number of social contacts.
- Social isolation is an objective state of having few or no social relationships or infrequent social interaction.
According to senior citizens statistics from the World Health Organization (2023), about one in four older adults worldwide experience social isolation or loneliness. These factors are strongly linked to depression, anxiety, cognitive decline, and even premature death.
In the United States, senior citizens statistics on living arrangements reveal the scale of potential isolation:
- 28% of older Americans (about 16.2 million people) live alone, with the proportion rising sharply with age.
- 33% of women aged 65+ live alone, compared with 22% of men.
- Among women aged 75 and older, the figure climbs to 42% living by themselves.
- While 59% of older adults live with a spouse or partner, a significant share of the oldest-old are widowed—29% of all older women are widows (ACL, 2023).
- Only 1.3 million (about 2%) of people 65+ live in nursing homes, but the percentage increases to 8% among those 85+, further reducing daily social contact for the oldest-old.
Loneliness and isolation are more than just social issues—they have serious health consequences. Research from the National Academies of Sciences, Engineering, and Medicine (2020) shows that socially isolated seniors have:
- A 50% increased risk of developing dementia
- A 29% higher risk of heart disease
- A 32% higher risk of stroke
- And overall mortality risks comparable to smoking 15 cigarettes per day
The psychological toll is equally severe. WHO estimates that 27.2% of global suicide deaths occur among people aged 60 and older, with loneliness, bereavement, and declining health acting as major triggers.
Why this matters: Senior citizens statistics consistently show that living alone does not always mean loneliness, but it significantly increases the risk of social isolation—especially for widowed or very old adults. Social connection is a powerful protective factor for healthy aging, reducing the risks of depression, anxiety, cognitive decline, and chronic disease. Building age-friendly communities, fostering intergenerational programs, and supporting widowed or homebound seniors are crucial steps to mitigate these risks.
Sources:
WHO. Mental health of older adults
ACL. Profile of Older Americans
Access to Mental Health Support and Interventions
Despite growing awareness, access to mental health services remains a persistent challenge for older adults in the U.S. According to the World Health Organization, approximately 14% of adults aged 60 and over live with a mental disorder—mainly depression and anxiety.
Yet many go untreated: nearly two‑thirds of older adults with mental health problems receive no treatment.
🧩 Community‑Based Interventions: An Undervalued Lifeline
Community programs play a vital role, especially for those affected by isolation or bereavement. The National Academies report that social isolation in older adults poses health risks comparable to smoking 15 cigarettes a day, elevating risks for dementia, heart disease, and premature mortality—making community interventions not just helpful, but essential.
Evidence from randomized controlled trials (RCTs) demonstrates benefits of interventions like:
- Structured peer companionship
- Narrative-based reminiscence groups for emotional support
- Volunteering that boosts life purpose and reduces loneliness
These show modest-to-strong results in improving mental well‑being, especially over the short to medium term, even if long-term effects vary by format and intensity.
👥 Layperson and Family-Based Support
Non-professional support networks—volunteers, faith-based groups, families—are central in bridging care gaps:
- Friendly check-ins, phone calls, and companionship services reduce loneliness and anxiety
- Caregiver mental health training helps detect early signs of depression or decline
- Helplines such as NCOA’s May‑2025 article reports that nearly 15% of adults aged 50 and older have some type of mental disorder, and two‑thirds go untreated—underscoring widespread underdiagnosis and lack of help-seeking behaviors
These approaches are scalable, culturally adaptable, and significantly enhance emotional resilience without requiring clinical infrastructure.
Source:
WHO. Mental health of older adults
NCOA. Mental Illness and Older Adults: What to Know About Symptoms and Treatment
Oxford Academic. Mental Health Interventions With Older Adults and the Policy Implications
National Academies. Social Isolation and Loneliness in Older Adults
Institute on Aging. Friendship Line California
Suicide Rates and Crisis Intervention for Seniors
While suicide is often discussed in the context of younger populations, older adults—especially men aged 75 and older—face the highest suicide rates in the United States. This age group often contends with compounding risk factors such as chronic illness, grief, loneliness, or lack of mental health support, making targeted prevention efforts essential.
📊 Suicide Rates Among Older Adults (2022)
According to the CDC’s National Vital Statistics System:
- Men aged 75 and older had a suicide rate of 43.9 deaths per 100,000, the highest of any age-gender group in the U.S.
- Women aged 75 and older had a suicide rate of 4.6 deaths per 100,000.
- The combined suicide rate for all adults aged 75+ was approximately 20.9 per 100,000, nearly 50% higher than the overall U.S. rate of 14.2 per 100,000.
These figures are a stark reminder that senior citizens statistics must include mental health metrics—not just physical or economic indicators—when addressing the well-being of America’s aging population.
🧠 Key Risk Factors
Several interwoven factors contribute to increased suicide risk in seniors:
- Social isolation due to retirement, widowhood, or limited mobility
- Chronic pain and disabling health conditions
- Undiagnosed or untreated depression (often mistaken as a normal part of aging)
- Access to lethal means, especially firearms—used in the majority of suicides among older men
🆘 Crisis Intervention Services
Effective, age-appropriate support services are vital. Seniors and caregivers can turn to:
- 📞 988 Suicide & Crisis Lifeline – Free 24/7 support by dialing 988
- 🤝 Friendship Line (Institute on Aging) – The only 24-hour crisis line specifically for seniors
- 🏡 Area Agencies on Aging (AAA) – Local services that include wellness checks, counseling referrals, and in-home support
💡 Building Protective Connections
Preventing suicide in older adults involves a mix of proactive care, education, and social support:
- Routine mental health screenings during primary care visits
- Expanding telehealth access and peer support networks
- Encouraging firearm safety conversations with families and providers
- Promoting social engagement through volunteer programs, senior centers, and digital communities
Incorporating mental health into broader senior citizens statistics ensures that public health strategies respond to emotional well-being—not just physical survival—in later life.
Source:
CDC, NCHS Data Brief No. 509
Disability, Mobility Challenges, and Support Needs for Seniors
As adults age, many face increasing challenges related to disability and mobility that impact their independence and quality of life. Senior citizens statistics help illustrate the scope of these issues in 2025, as well as the growing need for caregiving, accessibility, and community support services.
Overview: How Disability Affects Senior Independence
Disability has a profound impact on the independence and quality of life of older adults, especially as they age. According to the 2023 American Community Survey conducted by the U.S. Census Bureau, 24.0% of seniors aged 65 to 74 and 46.5% of those aged 75 and over live with at least one form of disability.
These figures demonstrate how aging significantly increases the likelihood of physical or cognitive impairments that affect daily functioning.
Among all Americans aged 65 and older (totaling approximately 54.6 million people), the most common disability is ambulatory difficulty, reported by 20.7% of seniors. This includes serious difficulty walking or climbing stairs—functions essential to living independently. Other major disability types include:
- Hearing difficulty: 13.5%
- Independent living difficulty: 13.3%
- Cognitive difficulty (e.g., memory or decision-making challenges): 8.0%
- Self-care difficulty (bathing or dressing): 7.2%
- Vision difficulty: 6.0%
These challenges can lead to reduced autonomy, social isolation, and increased reliance on caregivers or assistive technologies. Everyday tasks such as preparing meals, managing medications, or leaving the house may require help, which can be emotionally distressing for seniors who value their independence.
Understanding the role disability plays is essential to interpreting senior citizens statistics and developing support systems that allow aging adults to remain safe, mobile, and connected in their communities.
Source:
U.S. Census Bureau, American Community Survey, Table S1810: Disability Characteristics
Assistive Devices and Home Modifications
As seniors face mobility challenges or disabilities, assistive devices for seniors and thoughtful home modifications can play a crucial role in preserving independence, improving safety, and supporting emotional well-being.
📊 Widespread but Uneven Use of Assistive Devices
According to senior citizens statistics from the National Health and Aging Trends Study (NHATS), nearly 40% of adults aged 65 and older in the U.S. live with a disability affecting basic activities like bathing, dressing, or moving around the home. Many older adults use assistive tools such as canes, walkers, grab bars, raised toilet seats, and adaptive utensils to stay safe and mobile.
However, the effectiveness of these tools varies. In a 2024 study analyzing five years of NHATS data:
- 28.7% of older adults successfully used assistive devices to support bathing.
- 37.9% did so for toileting—making these the most effectively supported activities.
But even with assistive technology, a portion of seniors continued to report reduced activity, difficulty, or dependence on others. For example, among those who used mobility aids to go outside, 6.2% still needed human assistance.
💔 When Technology No Longer Fits, Well-Being Suffers
The same study revealed a clear pattern: when assistive devices no longer fully meet a senior’s needs, their subjective well-being declines. Seniors whose tools helped them participate fully in daily activities reported nearly the same level of happiness and confidence as those without any disabilities.
🏠 Common Home Modifications That Help
- Grab bars and non-slip flooring in bathrooms
- Wider doorways and ramps for wheelchair access
- Raised chairs and bed handles
- Smart devices for emergency alerts, reminders, and lighting control
🔄 Planning Ahead with Confidence
Given the dynamic nature of disability and aging, experts recommend reassessing assistive devices for seniors and home environments at least once a year, especially after a hospitalization or fall. With the right support, more older adults can age in place safely, minimizing caregiver burden and avoiding costly interventions.
Support Systems: Caregivers, Transportation, and Community Programs
As people age, physical and cognitive limitations become increasingly common—posing challenges not just to personal independence but also to health access, emotional well-being, and daily functioning.
According to recent senior citizens statistics from the CDC, nearly 44% of U.S. adults aged 65 and older live with at least one functional disability, such as mobility difficulties, cognitive impairment, or limitations in self-care. These challenges often intersect with socioeconomic disadvantages, chronic illness, and reduced community engagement, amplifying the support needs of older adults.
Disability does not inherently mean poor health or isolation. However, disparities in health access, transportation availability, and social support systems continue to affect seniors with disabilities disproportionately. From unpaid family caregivers to structured community programs, a network of formal and informal support is essential to help older adults age with dignity and remain connected to their communities.
👨👩👧👦 Family Caregivers: The Front Line of Support
Behind nearly every older adult living with a disability is a caregiver—often unpaid, often untrained—quietly holding together the threads of daily life. According to national senior citizens statistics, approximately 34.2 million Americans have provided unpaid care to someone aged 50 or older in the past year.
Many of these caregivers are themselves aging; nearly 1 in 10 caregivers is age 75 or older, often providing round-the-clock support to a spouse while managing their own declining health and fixed income.
As the number of older adults living with mobility, cognitive, or self-care challenges grows, so too does the complexity and intensity of caregiving.
On average, family caregivers provide over 24 hours of care per week, with nearly a quarter offering 41 hours or more. These high-hour caregivers often assist with not just bathing, dressing, or toileting, but also with medical and nursing tasks—such as managing medications, monitoring blood pressure, or even handling catheters and feeding tubes. Remarkably, 42% perform these tasks without any formal training.
Caregiving is deeply personal, but its toll is structural. Nearly half of high-hour caregivers report experiencing high emotional stress, while over 1 in 5 say their own health has worsened due to caregiving. Many juggle full- or part-time jobs, sacrificing work hours or retirement security, and still receive little formal assistance. In fact, 1 in 3 caregivers has no help at all—paid or unpaid—placing the full burden of care on a single individual.
What makes this role even more difficult is that half of all caregivers say they had no choice in taking on the responsibility. This sense of obligation—especially in the context of supporting aging parents or chronically ill spouses—can amplify stress and reduce caregivers’ willingness to seek outside help.
Yet despite the strain, caregivers are an irreplaceable part of the long-term care ecosystem. They are care coordinators, advocates, emotional anchors, and decision-makers. Any comprehensive effort to support seniors—whether through community programs, transportation services, or health equity initiatives—must recognize and include the family caregiver.
As senior citizens statistics show, aging and disability often go hand in hand, and supporting the people who care for older adults is vital to preserving the well-being of the aging population.
🚐 Transportation Services: A Vital Link to Independence
Transportation is more than a convenience—it’s a lifeline. For older adults with disabilities or mobility challenges, the ability to attend medical appointments, buy groceries, visit family, or simply socialize depends heavily on accessible and reliable transportation.
According to senior citizens statistics, nearly 1 in 5 adults aged 65 and older no longer drive, and for many, this loss of independence is one of the most difficult life transitions they face.
Yet the demand for transportation support far exceeds the reach of traditional public transit, particularly in rural and suburban areas where most older adults live. In many such communities, public transportation may be limited or nonexistent, creating what experts describe as “transportation deserts” for aging adults.
Without viable alternatives, seniors often miss vital medical care, forgo social interaction, or face premature institutionalization—all of which are associated with worse physical and mental health outcomes.
Family caregivers frequently fill the transportation gap—in fact, 78% provide or arrange rides for their loved ones, contributing to an estimated 1.4 billion rides annually. But not all seniors have family nearby, and for those requiring frequent trips (such as for dialysis or chemotherapy), family support alone is rarely enough.
In response, communities are developing creative transportation solutions tailored to the needs of older adults, such as:
- Dial-a-Ride services, offering curb-to-curb transportation at scheduled times
- Volunteer driver programs, often coordinated through local nonprofits or churches
- Assisted transportation, which includes “door-to-door” or “door-through-door” support, especially for those with physical or cognitive impairments
- Mobility management and one-call/one-click centers, which help seniors and people with disabilities navigate and select the best available transportation options
Many of these programs receive funding from sources like the Federal Transit Administration’s Section 5310 Program or Title III-B of the Older Americans Act, but resources are often stretched thin.
To maximize impact, experts recommend involving older adults and people with disabilities in the design of local transit systems, ensuring services are safe, comfortable, and clearly communicated. Travel training, personalized assistance, and ADA-compliant design all help ensure that transportation options are not just available—but truly usable.
Ultimately, transportation is foundational to aging in place with dignity. As highlighted by recent senior citizens statistics, mobility challenges and access barriers are key factors affecting seniors’ ability to live independently. Expanding and improving these services is not a luxury—it is a necessity embedded in the future of equitable senior care.
🏘️ Community Programs and Social Support
As older adults face mobility limitations, chronic conditions, or the loss of close relationships, local community support becomes a vital part of aging well. According to senior citizens statistics, nearly 9 in 10 older adults prefer to age in place, choosing to remain in their homes and communities for as long as possible. However, aging in place successfully depends on access to everyday services that promote health, engagement, and emotional well-being.
Area Agencies on Aging (AAA) play a central role in supporting this goal. Located in every U.S. state and territory, AAAs coordinate a wide range of services, including home-delivered meals, case management, in-home support, caregiver respite, and accessible transportation. You can find your local AAA through the Eldercare Locator, a free national service maintained by the U.S. Administration for Community Living.
Another comprehensive solution is the Program of All-Inclusive Care for the Elderly (PACE). PACE combines Medicare and Medicaid benefits into a single coordinated care model, delivering services such as adult day care, rehabilitation, transportation, and home health care. It is designed for older adults who meet nursing home level of care but want to remain in the community. View the latest PACE quick facts here.
Beyond these formal structures, senior centers serve as daily lifelines—offering exercise classes, cultural events, social activities, nutrition programs, and wellness screenings. They create low-barrier opportunities for connection, especially important given that social isolation among older adults is associated with depression, cognitive decline, and higher mortality rates. The National Institute on Aging highlights this connection and provides tools for reducing isolation in later life.
Additionally, faith-based and cultural organizations play critical roles, particularly in immigrant and underserved communities. They may offer language-specific services, home visits, transportation, or emotional support tailored to cultural values.
Many communities are also expanding access to volunteer companionship programs, intergenerational outreach, and specialized wellness initiatives. The National Council on Aging (NCOA) is a leading resource for these efforts, offering tools for local partners to build inclusive programs that support the mental, physical, and financial health of older adults.
Ultimately, community programs aren’t just about services—they are about dignity, connection, and autonomy. As senior citizens statistics show, the need for coordinated, accessible community support will only grow in the coming decades. Ensuring every older adult has access to these networks is key to helping them live not just longer—but better.
Source:
CDC. Prevalence of Disabilities and Health Care Access by Disability Status and Type Among Adults
CDC. Disability and Health Data Now
COMMED. Caregiving in the U.S.
NADTC. Transportation: Aging & Disability
NADTC. Unique Issues Related to Older Adults and Transportation
Unequal Access to Support by Income, Race, or Geography
While many seniors in the U.S. face similar challenges with aging, their ability to access support services—such as home modifications, mobility aids, medical care, and caregiving—is far from equal. Access is shaped by income, race, and geographic location, leaving millions underserved.
🏠 Homes That Don’t Support Aging
In 2022, one in three older adults (33%) reported having a disability, including:
- 21% with serious difficulty walking or climbing stairs
- 13% with difficulty doing errands alone
- 7% with difficulty bathing or dressing
Yet only 10% of U.S. homes are equipped to accommodate the needs of aging residents. Even among households that include someone with an accessibility need, less than one in five had a ramp or lift installed. Most seniors continue to live in environments that were never designed for aging in place, increasing the risk of falls, isolation, and premature institutionalization.
These disparities highlight a growing issue in senior citizens statistics: while health and mobility challenges are common, access to safe and supportive home environments remains limited for a large portion of the older population.
🧑⚕️ Delayed or Missed Medical Care
In 2022, 3% of seniors said they had skipped needed medical care due to cost. Others rely heavily on emergency departments for health crises that could have been prevented with regular care—23% had an ER visit in the past year. Out-of-pocket healthcare costs averaged $7,540, significantly higher than the national average, often leading seniors to delay or avoid essential support services such as home health aides, physical therapy, or assistive equipment.
🤝 Reliance on Informal Caregivers
Rather than having access to formal caregiving support, many seniors depend on family members. Between 2021 and 2022, 37.1 million family caregivers provided unpaid care to older adults. Seniors who lack family nearby—or those in marginalized communities—may receive little or no daily assistance at all. This gap is particularly stark in rural and low-income areas, where paid caregiving resources are scarce or nonexistent.
🗺️ Support Gaps by Region
Geography also plays a critical role. Seniors in remote or rural areas often face:
- Fewer home care agencies or therapists
- Limited access to accessible public transit
- Greater distances to hospitals and medical specialists
With just 3% of older adults changing residence in a given year, most remain in their current homes, even if local resources fail to meet their evolving needs. This immobility compounds regional inequities captured in national senior citizens statistics, underscoring the need for more localized aging-in-place strategies.
Source:
ACL. Profile of Older Americans
Reading Habits, Brain Exercises, and Cognitive Engagement Among Seniors
Staying mentally active is a key part of healthy aging, helping to preserve memory, focus, and overall cognitive function. Senior citizens statistics shed light on how reading, puzzles, and other brain-stimulating activities contribute to mental well-being and engagement among older adults in 2025.
Popular Cognitive Activities Among Seniors
Staying mentally active is one of the most effective ways for older adults to maintain a sense of purpose, improve focus, and enjoy daily life. According to recent senior citizens statistics from the U.S. and UK, many older adults regularly engage in cognitive activities that stimulate the brain while also offering relaxation and joy.
Here are some of the most popular cognitive activities for seniors today:
📖 Reading Books, Newspapers, and Magazines
Reading remains one of the most common and enjoyable pastimes for seniors. From novels and short stories to local newspapers and religious texts, reading helps maintain mental sharpness and provides a source of comfort, nostalgia, and lifelong learning.
Many older adults particularly enjoy short, feel-good stories that are easy to read and emotionally uplifting. If you’re looking for free, large-print stories specifically written for seniors, be sure to explore our curated collection here:
👉 100 Free Short Stories for the Elderly to Read Online
These stories are ideal for daily reading breaks and perfect for those who may have limited attention spans or memory challenges.
🧩 Puzzles and Brain Games
Crossword puzzles, Sudoku, jigsaw puzzles, and logic games are especially popular among older adults for good reason—they combine entertainment with memory and problem-solving practice. Puzzle books designed specifically for seniors (featuring large print and accessible challenges) are widely used at home and in senior centers.
🃏 Card Games and Board Games
Playing bridge, poker, checkers, or Scrabble isn’t just fun—it also helps seniors practice strategic thinking and social interaction. Group game nights remain a staple activity in many retirement communities across the U.S.
🗣️ Book Clubs and Reminiscence Writing
Many older adults enjoy participating in informal book discussion groups or engaging in reminiscence writing, where they reflect on personal memories or historical events they’ve lived through. These activities stimulate memory, encourage creativity, and often foster new friendships.
🎨 Creative Hobbies and Artistic Expression
Knitting, painting, journaling, or even adult coloring books—these creative outlets not only stimulate the brain but also offer therapeutic benefits. For many seniors, creative projects bring a sense of accomplishment and peace.
💻 Digital Cognitive Activities
Increasingly, seniors are embracing technology to keep their minds active. Apps like Lumosity, online chess, memory games, and YouTube educational channels are growing in popularity. In fact, according to the UK’s Office for National Statistics, adults over 70 now spend more time online than any other age group except those in their twenties—averaging over 43 minutes per day.
Engagement in these activities not only helps prevent cognitive decline but also reflects broader patterns found in senior citizens statistics—especially the increasing digital participation and educational levels among older adults in recent years.
Source:
The Guardian. Over-70s are UK’s most online adults after twentysomethings, survey shows
Reading Habits and Preferences
Reading remains a valuable activity among older adults in the United States—not only as a leisure pursuit, but also as a way to support cognitive health, emotional well-being, and even social connection. However, how frequently seniors read—and what they prefer to read—can be shaped by a wide array of social determinants of health (SDOH), including income, education, race, and living environment.
According to the Pew Research Center, about 23% of U.S. adults reported not reading any books in the past 12 months—in any format, including print, e-book, or audio. Adults over age 50 were more likely to be non-book readers than their younger counterparts, and those with lower income and education levels also read less frequently.
These patterns point to broader structural barriers that may limit access to reading materials, such as affordability, digital literacy, or proximity to libraries.
Yet, among those who do read, books remain an important part of daily life. Fiction, biography, and historical nonfiction rank high in popularity. Many older adults also adapt to age-related vision changes by turning to large-print books, audiobooks, or e-readers with adjustable font sizes.
Importantly, these disparities are not just about personal preference—they reflect deeper systemic factors. As the Centers for Disease Control and Prevention (CDC) emphasizes, SDOH like safe housing, community design, education quality, and income security have a profound impact on how people age and engage with daily life—including reading habits.
For instance, older adults living in low-income neighborhoods may lack safe transit options to access libraries or community centers, while those with limited literacy opportunities earlier in life may feel less confident engaging with written material.
Promoting reading among seniors, then, isn’t just about offering books—it’s about addressing the conditions that shape access, motivation, and ability. Libraries, senior centers, and health professionals all play a role in encouraging reading as part of holistic aging.
At the same time, supportive environments that reduce isolation, improve economic stability, and enhance lifelong learning are crucial for empowering older Americans to remain mentally active and emotionally fulfilled through reading.
Source:
Pew Research Center. Who Doesn’t Read Books in America?
National Institute on Aging. Cognitive Health and Older Adults
CDC. Social Determinants of Health (SDOH)
Impact on Cognitive Health and Well-Being
For older adults, engaging in mentally stimulating activities isn’t just a way to pass the time—it can make a measurable difference in long-term brain health and even life expectancy.
A growing body of evidence, supported by recent senior citizens statistics, shows that cognitive activities like reading, puzzles, games, and hobbies can help preserve memory, delay cognitive decline, and reduce the risk of mortality in later life.
🧠 Slower Cognitive Decline for Seniors Who Stay Mentally Engaged
A 2024 study from Texas A&M University analyzed data from nearly 6,000 older adults in the U.S. Health and Retirement Study (HRS). It found that seniors with mild cognitive impairment who regularly engaged in cognitive activities—such as reading, puzzles, and hobbies—scored consistently higher on memory, attention, and processing speed tests over an eight-year period compared to those who did not.
Those who participated in these activities three to four times a week saw the most benefit. The study concludes that high levels of participation can help maintain stable cognitive performance even in the presence of early cognitive decline.
📘 Texas A&M via ScienceDaily
📖 Reading Prevents Long-Term Decline, Regardless of Education
A 14-year longitudinal study published in International Psychogeriatrics followed 1,962 Taiwanese seniors aged 64 and above. The study revealed that reading once or more per week significantly reduced the risk of cognitive decline—by as much as 46% over 14 years.
Importantly, the protective effect of reading applied across all education levels, including those with limited formal schooling. This suggests that reading is a simple, accessible intervention that can benefit nearly all older adults, regardless of background.
💀 Reduced Mortality Risk from Multiple Cognitive Activities
Cognitive stimulation isn’t just good for the brain—it may also help seniors live longer. A 4-year community-based cohort study in Shanghai followed 4,003 adults aged 60+ and tracked participation in cognitive leisure activities like reading, computer use, and playing mahjong or cards.
Participants who engaged in multiple types of cognitive leisure activities had a 28% lower risk of death from all causes compared to those who didn’t engage in any.
The positive effect was strongest in those aged 80 and above, and among seniors with cognitive impairment, showing that it’s never too late to benefit.
👥 Who Benefits the Most?
Participants who engaged in multiple types of cognitive leisure activities had a 28% lower risk of death from all causes compared to those who didn’t engage in any.
The positive effect was strongest in those aged 80 and above, and among seniors with cognitive impairment, showing that it’s never too late to benefit.
These studies also highlight that:
- Seniors with lower education levels gain just as much—or even more—cognitive protection from reading and games.
- Those who are physically inactive can still benefit mentally and emotionally from cognitive engagement.
- Seniors with chronic conditions or limited mobility may find brain-based activities to be one of the few accessible and impactful forms of wellness.
These findings reinforce what many caregivers and families observe anecdotally: a curious mind is a resilient mind. Informed by these insights and supported by credible senior citizens statistics, it’s clear that promoting simple habits—like reading a short story, solving a crossword puzzle, or playing a game of cards—can have profound, long-term effects on a senior’s quality of life and health outcomes.
If you’re looking for a meaningful way to help an older loved one stay mentally active, consider making cognitive activities part of their everyday routine. One easy place to start is with short, heartwarming stories that are easy to read and designed especially for seniors.
👉 Explore our collection of 100 free short stories for the elderly to read online—they’re perfect for a cozy afternoon break, a bedtime routine, or even shared reading moments between generations.
The benefits may extend far beyond the moment of enjoyment.
Source:
ScienceDaily. Games, puzzles and reading can slow cognitive decline in the elderly — even in those with mild cognitive impairment
Cambridge University Press. Reading activity prevents long-term decline in cognitive function in older people: evidence from a 14-year longitudinal study
BMC Geriatrics. Cognitive leisure activity and all-cause mortality in older adults: a 4-year community-based cohort
Trends in Cognitive Engagement Over Time
Over the past few decades, how older adults engage their minds has quietly transformed. Once focused primarily on physical well-being, aging research and public health programs have increasingly turned their attention to cognitive health—and for good reason.
A landmark 14-year longitudinal study published in International Psychogeriatrics tracked nearly 2,000 older adults in Taiwan and found a strong, consistent link between reading and long-term cognitive function. Those who read at least once a week were 46% less likely to experience cognitive decline—even after accounting for education, physical ability, and chronic illness. The protective effects of reading held steady across 6-year, 10-year, and 14-year spans, with adjusted odds ratios as low as 0.54 for frequent readers.
“The benefits weren’t limited to highly educated seniors,” the researchers noted. “In fact, those with the lowest education levels saw some of the greatest long-term gains from regular reading.”
This challenges the old assumption that intellectual activities only benefit those with formal schooling. The study showed that reading protects brain function independently of education level, suggesting that everyone—regardless of background—can build “cognitive capital” over time.
🧠 From Paper Pages to Digital Screens
Alongside the growing awareness of cognitive health, the way seniors read and engage with information has also evolved.
While many older adults still love the tactile joy of a paperback book, others have embraced new formats:
- E-books with adjustable fonts
- Audiobooks that reduce visual strain
- Online articles, digital magazines, and mobile reading apps
This shift isn’t just about convenience—it reflects a broader cultural trend: seniors are not “slowing down,” they’re adapting. They’re exploring new ways to stay mentally sharp, emotionally engaged, and socially connected.
“My dad started with a crossword book. Now he listens to short stories on his tablet while gardening,” one caregiver shared. “It’s his daily routine—like taking vitamins, but for the brain.”
📊 The Big Picture: A Lifelong Mental Habit
What we’re seeing isn’t just a temporary interest in brain games or a passing hobby—it’s a generational shift. Today’s seniors:
- Read more regularly than previous generations
- Stay curious longer into old age
- Value cognitive wellness as part of overall health
Experts now recommend that cognitively stimulating activities like reading be integrated into daily routines, not just prescribed after memory starts to fade. And research shows that even light, leisurely reading—fiction, memoirs, even poetry—can make a measurable difference over time.
Reading isn’t just good for the brain. It offers structure, peace, joy, and a way to keep the mind feeling useful, sharp, and alive—no matter what the calendar says.
How Seniors Use Technology and the Internet (2025 Data)
Technology is playing an increasingly important role in the lives of older adults, from staying connected with family to accessing healthcare and entertainment. Senior citizens statistics from 2025 reveal how internet use, device adoption, and digital literacy are shaping the daily experiences of seniors across the U.S.
Device Ownership and Internet Access Among Seniors
The stereotype of seniors struggling with technology is quickly becoming outdated. In 2025, older adults aren’t just owning devices—they’re using them with growing comfort, purpose, and even joy. Many also carefully manage what they spend on phone service, balancing new tech habits with practical costs.
According to the latest Pew Research and ATUS data, smartphone adoption, internet access, and screen time among Americans 60 and older have all surged in the past decade, transforming how seniors connect with the world—and with themselves.
🔢 What the Numbers Say (and What They Don’t)
- 73% of Americans 65+ are now online—a dramatic rise from just 14% in 2000
- 53% of those 65+ now own a smartphone (up from 27% in 2015)
- Among 50–64 year olds, 79% now get news on their phones
- Even among those 65+, 67% get news via mobile—a 24-point jump in just one year
But the story isn’t just about access—it’s about how seniors feel about these devices. A 2024 Pew study found that:
- 82% of smartphone-owning seniors say their phone represents freedom, not a leash
- Only 18% describe their phones as “distracting,” compared to 37% of younger adults
🪑 What They Actually Do Online
Screen time among seniors is rising—not due to endless scrolling, but because of deep shifts in how they spend leisure. A decade ago, Americans 60+ spent about 3 hours daily on screens. In 2025, it’s now over 4 hours and 16 minutes a day—more than half their total leisure time.
Most of that time goes to:
- 📺 Watching TV and videos
- 💬 Reading news and checking email on phones/tablets
- 🧠 Playing digital puzzles or games
- 👨👩👧 Video calls with family
- 📘 Exploring story sites or YouTube for hobbies
Yet seniors still read and socialize slightly less than they did a decade ago. Those with lower education levels spend more screen time and less time on reading or exercise—highlighting the importance of accessible, meaningful content.
🧠 Screen Time NOT EQUAL TO Connection Time
Despite the increase in hours spent on screens, most older adults don’t see it as mindless consumption. For them, smartphones, tablets, and smart TVs are not “gadgets”—they are lifelines.
One survey participant put it simply:
“It’s not just a phone. It’s how I talk to my daughter. How I check the weather. How I know what’s going on in the world.”
In other words, devices aren’t replacing relationships—they’re supporting them.
Source:
Pew Research. Growth in mobile news use driven by older adults
Pew Research. For vast majority of seniors who own one, a smartphone equals ‘freedom’
Pew Research. Americans 60 and older are spending more time in front of their screens than a decade ago
Online Activities and Digital Behavior
For older Americans, going online is no longer a novelty—it’s a routine. But what they do once they’re connected tells a different story than younger generations.
While younger adults often use the internet for streaming, social media, or multitasking across apps, seniors tend to focus on a smaller set of meaningful, practical activities. It’s not about being constantly plugged in—it’s about using technology to enhance daily life.
According to recent Pew Research and BLS data, Americans aged 60 and older spend more than four hours per day of their leisure time on screens—the majority of their total daily leisure. This marks an increase of nearly 30 minutes compared to a decade ago.
The most common online activities include:
- Watching TV, YouTube, and videos (still the #1 digital pastime)
- Reading news articles—especially via mobile phones
- Checking personal email and staying updated with friends or family
- Playing casual digital games like crossword puzzles, card games, or Sudoku
- Video calls and messaging with children or grandchildren
- Looking up health information, recipes, how-to videos, or weather updates
These activities reflect a strong orientation toward information, connection, and comfort—not distraction.
What’s especially notable is how seniors feel about their digital habits.
A 2024 Pew survey found that 82% of seniors who own smartphones say their phone represents “freedom,” not a leash. In contrast, only 64% of younger adults feel the same way. Older users are also far more likely to describe their phone as “connecting” rather than “distracting.”
This makes sense given how seniors use their devices: for calling, texting, emailing, reading, and checking in with family—not as a tool for constant stimulation or entertainment. Their behavior reflects a more intentional and emotionally grounded approach to technology.
Technology habits among seniors aren’t one-size-fits-all. Time-use data reveals clear differences based on educational attainment:
- Seniors with less education (high school or below) tend to spend more time on screens, mostly TV and video content.
- Seniors with college degrees spend more time reading, exercising, and using the internet for active learning or enrichment.
- Even among non-working adults, those with less education average 30–60 more minutes of daily leisure, often in more passive formats.
This divide has implications—not just for access, but for the type of online content that resonates. While some seniors seek mental stimulation, others look for ease, comfort, and familiarity.
The internet isn’t replacing the routines of older adults—it’s becoming part of them. Whether it’s checking the weather, watching a favorite YouTube gardener, or joining a Zoom birthday call, seniors are embracing digital life in deliberate, satisfying ways.
And as more services, stories, and conversations move online, their digital behavior isn’t just adapting to technology—it’s shaping it.
Source:
Pew Research. Growth in mobile news use driven by older adults
Pew Research. For vast majority of seniors who own one, a smartphone equals ‘freedom’
Pew Research. Americans 60 and older are spending more time in front of their screens than a decade ago
Barriers to Technology Adoption and Use
While more seniors are online than ever before, a significant share still remain disconnected—not by choice, but by circumstance.
As of 2025, roughly 73% of Americans aged 65 and older use the internet. That’s a dramatic improvement from just 14% in 2000. But it also means more than a quarter of older adults are still offline. And even among those who are connected, many face quiet, persistent barriers that affect how—or whether—they can engage with technology meaningfully.
Some of these challenges are physical. Age-related conditions like arthritis, poor vision, and reduced dexterity can make it difficult to navigate touchscreens, use small buttons, or read on digital displays. For some, simply holding a phone for long periods or typing on a small keyboard is exhausting.
But perhaps the more overlooked obstacles are emotional and cognitive. Many older adults express uncertainty about using technology “the wrong way,” or fear accidentally breaking something. This hesitancy—especially when no one is nearby to help—can become a lasting source of avoidance.
In a recent Pew Research study, many seniors cited three common reasons for avoiding or limiting tech use:
- A lack of confidence in their ability to learn new technologies
- Skepticism about whether devices will truly improve their lives
- Frustration with complex design—unintuitive menus, cluttered apps, and small fonts
Even seniors who are open to using technology often find themselves stuck at the edge of access. Wi-Fi costs, device updates, app changes, and passwords can be intimidating for users without regular guidance.
Education also plays a role. Seniors with lower educational attainment are less likely to use the internet, less likely to explore new online activities, and more likely to spend their screen time passively (such as watching TV). The digital divide is no longer just about access—it’s about comfort, capability, and support.
What’s often missing is a helping hand—a patient voice, a simplified setup, or just the assurance that it’s okay to ask questions more than once. With that support, the gap begins to close. Without it, the risk isn’t just disconnection from the internet—it’s disconnection from modern life.
Technology, for seniors, is not simply about catching up. It’s about not being left behind.
Source:
Pew Research. Growth in mobile news use driven by older adults
Pew Research. For vast majority of seniors who own one, a smartphone equals ‘freedom’
Pew Research. Americans 60 and older are spending more time in front of their screens than a decade ago
Digital Literacy and Training Programs for Seniors
As technology becomes deeply embedded in daily life, digital literacy has shifted from being a “nice-to-have” skill to an essential part of maintaining independence, accessing services, and staying connected. Yet for many older adults, the path to digital inclusion is filled with obstacles — and without targeted training programs, the gap between those who are digitally connected and those who are not will only widen.
💡 The Challenges Older Adults Face in Building Digital Skills
Research consistently shows that seniors face unique and persistent barriers when learning new technologies.
A Frontiers in Education study of digital literacy instructors in Belgium found three broad categories of challenges:
- Language and Terminology Barriers – Technical jargon, often in English, can be confusing for learners whose first language is different, making it harder to follow instructions.
- Hardware and Device Management – Even basic tasks such as turning a device on, identifying the correct buttons, connecting cables, or managing storage space can feel daunting.
- Software and Internet Skills – Downloading and installing apps, managing accounts and passwords, dealing with software updates, and navigating online platforms are common pain points.
Similarly, the DIGILIFE Digital Literacy for Older People report (EU, 2019) highlighted the scale of the gap: only 16% of people aged 55–64 had digital skills above a basic level. Many older adults lack confidence, fear making mistakes, or have limited access to affordable devices and internet connections. Without targeted support, these challenges can contribute to digital exclusion.
🌏 Case Study: New Zealand’s Nationwide Digital Literacy Programme
One example of a structured, large-scale initiative comes from New Zealand. Launched in 2020, the Digital Literacy Programme for Seniors aims to train 4,700 older adults over three years, with funding from the government.
Its goals are to:
- Help seniors keep up with changing technology.
- Build trust and confidence in carrying out online activities, especially staying connected with family and friends.
- Improve digital inclusion nationwide.
Implementation:
Two contracted providers — Digital Inclusion Alliance Aotearoa and 20/20 Communications Trust — deliver training through a network of libraries, community organisations, local churches, and sessions in participants’ native languages. This grassroots approach ensures accessibility, especially for vulnerable populations.
📊 Measuring Success: The Essential Digital Skills/Literacy Evaluation Framework
New Zealand’s programme also introduced the Essential Digital Skills/Literacy Evaluation Framework, adapted from the UK’s Essential Digital Skills Framework and the NZ Digital Inclusion Blueprint.
It provides both a pre-training self-assessment (identifying what participants want to learn) and a post-training self-assessment (measuring skills gained and overall experience).
The framework evaluates skills in four key areas:
- Device Basics – turning devices on/off, adjusting settings, connecting to Wi-Fi, managing files.
- Online Activities – using search engines, online banking, shopping, filling in forms, making appointments.
- Social Connection – video calls, social media, setting privacy controls.
- Online Safety – creating strong passwords, spotting scams, updating security software, protecting personal data.
🏛 North American Approaches: Community-Driven Models
In North America, many training initiatives are led by public libraries, community centres, and housing associations.
A programme documented in the AGE-WELL APPTA Policy Rounds presentation brought together libraries, social service agencies, and grassroots groups to deliver training tailored to older adults living in social housing.
Key features included:
- Social Learning – small-group sessions that encourage peer-to-peer support.
- Flexible Scheduling – evening and weekend classes to suit different lifestyles.
- Content Adaptation – adjusting lessons based on learner feedback.
- Diverse Topics – from internet safety and online health information to creative activities like coding clubs.
Outcomes were positive: most participants reported improved digital skills, greater confidence, and better access to health and government services. However, sustainability remains a challenge due to reliance on external funding.
The Digital Skills Training and Older Adults – Scoping Review further confirms that across the United States and Canada, public libraries often serve as the primary hubs for senior digital training. Successful models tend to combine long-term mentorship with hands-on practice, rather than one-off classes.
🛠 Best Practices in Senior Digital Literacy Training
Drawing from these global and regional examples, several best practices emerge:
- Start with the Basics – ensure learners master fundamental device operations before moving to complex tasks.
- Use Real-Life Scenarios – tailor lessons to activities seniors care about (e.g., video calling family, managing online health records).
- Foster Social Interaction – group learning can reduce anxiety and encourage ongoing engagement.
- Provide Ongoing Support – offer follow-up sessions or helplines for troubleshooting.
- Measure Outcomes – use pre- and post-assessments to track skill growth and adapt future training.
Source:
McMaster University. Digital Skills Training and Older Adults: A Scoping Review
McMaster University. Community-Led Digital Literacy Training for Older Adults
WHO. The Digital Literacy Programme for Seniors and the Essential Digital Skills/Literacy Evaluation Framework
WHO. Essential Digital Skills/Literacy Evaluation Framework for Seniors
DIGILIFE. Digital Literacy of Older People
Trends Over Time in Senior Tech Use
The way seniors use technology today didn’t happen overnight. It’s the result of a steady—and at times surprising—evolution over the last two decades.
In the early 2000s, very few Americans over 65 were online. In fact, only 14% reported using the internet at all in the year 2000. Computers were expensive, internet speeds were slow, and most digital experiences weren’t designed with older adults in mind. For many, going online felt like stepping into a foreign world.
By 2010, access had improved, but adoption was still cautious. A growing number of seniors used desktops to send emails or look up health information, but smartphones were rare, and social platforms were still dominated by younger generations.
Everything started changing faster around 2015. That year, only 27% of adults 65 and older owned a smartphone. But as prices fell, interfaces improved, and family members began relying on digital tools for communication, more seniors started to engage. By 2025, 53% of older adults now own smartphones—nearly double the rate a decade ago.
Internet access tells a similar story. Between 2000 and 2025, internet use among seniors grew from 14% to 73%, a more than fivefold increase.
But perhaps the clearest sign of change is how seniors now use mobile devices. In 2013, just 22% of adults 65+ got their news on a phone. By 2024, that number had jumped to 67%, with a 24-point increase in just one year.
Time spent on screens has followed the same trajectory. A decade ago, older Americans averaged about three hours and 45 minutes of screen-based leisure per day. In 2025, that number has climbed to four hours and 16 minutes, now making up more than half of their total daily leisure time. And while television still dominates, more seniors are now supplementing with online videos, games, and digital reading.
These shifts show more than rising numbers—they reflect a cultural and generational turning point. Seniors are no longer hesitant adopters. Many are confident, curious, and willing to learn—as long as the tools feel useful and accessible.
The next phase of growth won’t be about whether seniors use technology—it will be about how comfortably, meaningfully, and independently they can keep using it as the digital world continues to evolve.
Source:
Pew Research. Growth in mobile news use driven by older adults
Pew Research. For vast majority of seniors who own one, a smartphone equals ‘freedom’
Pew Research. Americans 60 and older are spending more time in front of their screens than a decade ago
Top Hobbies, Leisure Activities, and Volunteer Work Among Seniors
Leisure time takes on new meaning in retirement, with many older adults engaging in hobbies, social activities, and community service. Senior citizens statistics from 2025 highlight the most popular ways seniors spend their free time—and the positive impact these activities have on well-being and purpose.
Most Popular Hobbies and Recreational Activities
Older adults in the United States spend more time on leisure and recreational pursuits than those in their late working years, reflecting changes in daily structure after retirement. In 2024, Americans aged 65 and older devoted an average of 6.95 hours per day to leisure and sports activities—more than 1.5 hours longer than the 5.34 hours recorded for those aged 55 to 64.
📺 Watching TV
Television is by far the most time-consuming leisure activity for both groups, but the gap widens with age. Adults 65+ spent 4.21 hours per day watching TV—over an hour more than the 3.08 hours for those aged 55 to 64. This difference reflects not only increased free time but also the role of TV as an accessible and familiar source of entertainment.
📖 Reading for Personal Interest
Reading remains a valued pastime, especially for older seniors. Those 65 and older read for 0.59 hours (about 35 minutes) per day, compared with 0.33 hours for the 55–64 group. The increase may stem from fewer work commitments and more opportunities to pursue personal or nostalgic reading interests.
🗣️ Socializing and Communicating
Social interaction holds steady across the two groups, with a slight dip in the older cohort. Those aged 55–64 averaged 0.59 hours per day socializing, compared with 0.56 hours among those 65+. This stability suggests that both pre- and post-retirement years maintain a similar level of social engagement, although the nature of interactions may shift from workplace contact to community, family, or peer activities.
🌿 Relaxing and Thinking
Time spent in quiet reflection rises modestly with age. Older seniors devoted 0.49 hours daily to relaxing and thinking, slightly more than the 0.42 hours for the 55–64 group. Such activities often complement other hobbies, providing mental rest and personal downtime.
🎮 Playing Games & 💻 Computer Use for Leisure
Both playing games and using computers for leisure remain minor time investments, but older seniors still spend slightly more time on games (0.25 hours) compared with the 55–64 group (0.18 hours). Computer use for leisure—excluding games—was low in both cohorts (0.18 hours for 65+, 0.15 hours for 55–64), reflecting modest digital adoption for purely recreational purposes.
🏃 Participating in Sports, Exercise, and Recreation
Physical activity accounts for a small share of daily leisure in both groups. Adults 65+ spent 0.3 hours (about 18 minutes) per day in sports, exercise, and recreational activities, slightly more than the 0.26 hours seen among those 55–64. While the increase is minimal, it underscores that many older adults remain physically active, even if the intensity and type of exercise shift with age.
Summary:
The data highlight a clear shift toward more home-based and lower-intensity activities as people transition from their late working years into full retirement. Television and reading dominate the leisure landscape for older seniors, while socializing, reflection, and light recreation fill out the remainder of their days. These patterns provide valuable context for program planners, marketers, and community organizations aiming to engage older adults in meaningful ways.
Source:
U.S. BUREAU of LABOR STATISTICS. Golden years: older Americans at work and play
U.S. BUREAU of LABOR STATISTICS. Average hours per day spent in selected leisure and sports activities by age
Social and Group-Based Activities
Social and group-based activities remain a central component of life for many older adults in the United States, offering opportunities for connection, purpose, and community engagement. Data from AARP and related research indicate that while participation patterns vary, many individuals aged 50 and older maintain active involvement in community groups, volunteer work, and social gatherings.
🤝 Group Membership and Community Engagement
Older adults often belong to multiple organizations that align with their interests, values, or local community ties. Among adults aged 50 and older, the average number of membership types is 3.0, with an overall average of 5.3 memberships regardless of type — a notable increase since 2009.
These memberships range from religious groups and hobby clubs to civic organizations and professional associations. However, the average number of civic and community activities participated in each year remains relatively modest, at about 2.4 out of 11 possible activities, slightly down from 2.5 in 2012.
🙋 Volunteering and Charitable Giving
Volunteering remains a significant form of social engagement, though trends differ between formal and informal activities. Since 2012, the rate of formal volunteering — defined as work done for organizations — has declined by 8 percentage points. In contrast, informal volunteering, such as helping neighbors or friends outside of organizational settings, has risen by 6 percentage points.
Roughly 43% of adults 50+ engage in both formal and informal volunteering. Charitable giving is also common, with seven in ten donating to charitable or religious causes in 2014, though this represents a slight decline from previous years.
🗨️ Social Interaction Frequency and Loneliness
Beyond structured group involvement, day-to-day social connections play a crucial role in older adults’ well-being. According to AARP’s Loneliness and Social Connections study, a significant proportion of adults aged 50 and older maintain regular contact with friends and family.
Many report speaking with friends or relatives at least weekly, and a large share participate in social activities — such as attending religious services, hobby meetups, or community events — at least monthly. However, the same research highlights that feelings of loneliness are still prevalent, especially among those with fewer social ties or limited mobility.
These findings underscore the importance of accessible, inclusive opportunities for both in-person and remote social interaction.
🌱 Implications for Aging and Community Health
The combination of group memberships, volunteering, charitable giving, and regular personal connections illustrates the multifaceted nature of social engagement among seniors. While participation in certain formal activities has seen slight declines, informal support networks and casual social interactions remain strong.
Ensuring that older adults have access to a variety of group-based and social opportunities — from volunteer roles to hobby clubs and digital meetups — can help maintain emotional well-being, reduce loneliness, and strengthen community bonds.
Source:
American Association of Retired Persons. Loneliness and Social Connections: A National Survey of Adults 45 and Older
American Association of Retired Persons. Connecting, Serving, and Giving: Civic Engagement Among Mid-Life and Older Adults
Volunteer Work and Civic Engagement
Volunteerism remains a vital component of civic engagement for older Americans, generating substantial economic and social value. In recent decades, older adults have demonstrated remarkable resilience in their volunteer participation, even during periods when overall volunteerism has declined nationwide. Their contributions extend far beyond simple acts of service—they help strengthen communities, address urgent needs, and foster intergenerational connection.
📈 Participation Trends and Demographics
According to national data, older adults have steadily increased their share of total volunteer hours in the U.S., despite a general decline in volunteerism among younger age groups. Many combine volunteering with other responsibilities, including employment, showing that civic engagement remains important even when time is limited. Participation spans formal roles through organizations and informal acts of helping within neighborhoods and families.
🤝 Major Volunteer Programs for Older Adults
A significant portion of formal volunteer engagement among older adults occurs through federally supported initiatives administered by the Corporation for National and Community Service (CNCS) under the Domestic Volunteer Service Act (DVSA). The AmeriCorps Seniors programs—RSVP, Foster Grandparent Program, and Senior Companion Program—offer structured opportunities with benefits such as stipends, transportation reimbursement, and insurance coverage, enabling older adults to serve in areas ranging from education and health to environmental stewardship and elder care.
🚪 Barriers and Opportunities
While older adults contribute significantly to community life, they may face challenges such as transportation limitations, physical restrictions, or limited access to information about opportunities. Addressing these barriers through better transportation services, flexible scheduling, and targeted outreach can help maintain and grow volunteer participation. Platforms like AARP’s Create the Good connect older adults with opportunities suited to their skills and interests.
🗳️ Civic Engagement Beyond Volunteering
Beyond formal volunteer roles, older Americans actively participate in civic life through voting, advocacy, community organizing, and serving in leadership positions. These contributions ensure that older voices help shape policies and decisions that affect communities, reinforcing democratic engagement and social cohesion.
Source:
NATION SWELL. How Older Adults Lead the Way in American Volunteerism
CONGRESS.GOV. The Corporation for National and Community Service: Overview of Programs and Funding
ACL. Profile of Older Americans
Trends Over Time and Post-Retirement Lifestyle Shifts
Retirement today looks very different from just a generation ago. Older adults are reshaping how they spend their days — balancing leisure, lifelong learning, travel, hobbies, and volunteer work in ways that reflect both post-pandemic realities and new opportunities in later life. The trends below highlight how senior lifestyles have evolved and where they may be heading next.
📈 Changes in Daily Leisure Time
According to IBISWorld and BLS’s American Time Use Survey, Americans aged 65+ now spend an average of 7.4 hours per day on leisure and sports activities, compared to about 5 hours for the general population. Television remains the dominant pastime (over 3 hours daily), followed by socializing, reading, and physical activity. Pandemic-related stay-at-home measures pushed leisure time to a peak in 2020, but hours gradually declined as the economy reopened. In 2025, leisure time is stabilizing — aided by more flexible work arrangements and the enduring popularity of home-based activities.
🧠 Lifelong Learning for Growth and Cognitive Health
AARP research shows that 55% of Americans aged 45+ are actively learning new things for personal growth. Popular topics include history, food and drink, mental health, basic technology, and nutrition. Lifelong learners spend an average of $75 annually on their interests, and 83% believe it’s vital to keep the brain active. Yet barriers remain: cost, time constraints, and ageism can discourage engagement, especially among adults over 60.
🌍 Travel and the “Retirement Reinvention”
The IHG Hotels & Resorts 2024 survey found that 60% of retirees plan or have already done a “retirement reinvention,” with travel at the top of the list.
- 40% mark retirement with a “trip of a lifetime.”
- 59% plan to travel more than during their working years.
- Top destinations include U.S. locations (59%), Europe (31%), and North America outside the U.S. (23%).
To fund these trips, half are willing to cut spending in other areas, and some retirees are even picking up part-time work to boost travel budgets.
🎨 Rediscovering Old Hobbies and New Skills
Post-retirement life is also a chance to dive back into passions or start fresh.
Top hobbies among retirees include:
- Gardening (43%)
- Reading (42%)
- Cooking (38%)
- Baking (28%)
- Fishing (22%)
Others are learning new languages, instruments, or crafts, with many motivated by both enjoyment and social connection.
🤝 Volunteer Work and Community Engagement
BLS ATUS data shows that older adults volunteer more hours per year than younger groups, often focusing on community, religious, and charitable causes. Volunteering provides structure, purpose, and opportunities to stay socially active — all factors linked to higher well-being in later life.
Source:
IBIS World. Time spent on leisure and sports
NY Post. How Americans are reinventing retirement
Bureau of Labor Statistics. American Time Use Survey
American Association of Retired Persons. Lifelong Learning Attracts Older Adults for Personal Growth and Cognitive Health
Income, Retirement Savings, and Financial Trends for Older Americans
Financial stability is a key factor in determining quality of life during retirement. Senior citizens statistics from 2025 provide a detailed look at income sources, savings levels, and economic challenges facing older Americans as they navigate their post-working years.
Primary Sources of Income for Seniors
For most Americans age 65 and older, retirement income comes from a mix of public benefits, personal savings, and work. The balance of these sources can vary widely depending on lifetime earnings, health, and family circumstances. Understanding where seniors’ income comes from helps explain both their financial security and the challenges many face in later life.
🏛 Social Security: The Backbone of Senior Income
Social Security remains the largest single source of income for Americans age 65 and older, covering about 90% or more of income for roughly 12% of beneficiaries, and providing at least half of income for over half of senior households.
For the majority of low- and middle-income seniors, Social Security is not just supplemental—it’s the foundation of their financial stability. This reliance is particularly strong among unmarried seniors and those over 80.
💼 Earnings from Work
While many seniors fully retire, a growing proportion continues to work part-time or even full-time past age 65. Earnings make up around 25% of total income for seniors on average, but this share is heavily skewed—higher-income households tend to earn more from work, while lower-income households rarely rely on it.
Continued employment often provides not just extra income, but also health coverage and a sense of purpose.
📈 Income from Assets and Investments
Asset income—such as interest, dividends, and rent—makes up about 12% of total senior income on average, but the distribution is highly unequal. Seniors in the top income quintile receive a substantial share of their income from investments, while those in the lowest quintile receive little to none.
Market volatility and low interest rates in recent years have affected this source, particularly for those relying on fixed-income investments.
🏦 Private Pensions and Retirement Accounts
Private pensions, 401(k)s, and IRAs together account for roughly 17% of seniors’ total income. Access to these sources is strongly correlated with past employment in unionized or public-sector jobs.
While pensions offer predictable payments, defined contribution plans such as 401(k)s shift investment risk to retirees, making income less stable.
🛡 Supplemental and Public Assistance Programs
For seniors with very low income, programs like Supplemental Security Income (SSI), Supplemental Nutrition Assistance Program (SNAP), and housing assistance can provide essential support. SSI benefits are modest—averaging just over $600 per month—but they can make the difference between poverty and basic stability for the most vulnerable seniors.
Retirement Savings and Financial Preparedness
While some older Americans enter retirement with substantial savings, many face a serious shortfall. Changes in pension structures, gaps in employment, and rising living costs have made financial preparedness increasingly difficult.
📊 Retirement Account Ownership
Federal Reserve data indicate that only 54% of U.S. households have a retirement account. Among adults aged 55–64, the median balance is just $10,000—far below what’s needed for a comfortable retirement.
🔄 From Pensions to 401(k)s
The shift from defined benefit (DB) pensions to defined contribution (DC) plans has placed more responsibility on individuals. Participation has grown, but contributions vary widely, and many workers experience savings gaps due to job changes or economic downturns.
📉 Disparities in Preparedness
White households have a retirement account participation rate of about 62%, compared to 25% for Hispanic households. Lower-income workers are also less likely to have access to employer-sponsored retirement plans.
🏥 Healthcare Costs as a Major Threat
Healthcare expenses—especially long-term care—can rapidly deplete retirement savings, even for well-prepared households.
🛠 Policy Measures
States have launched auto-enrollment IRA programs for workers without employer plans, and federal policies like the SECURE 2.0 Act aim to boost participation and contributions.
Source:
Federal Reserve Bank of Richmond. Rethinking Retirement Savings
Financial Challenges and Economic Vulnerabilities
Financial stability in retirement is increasingly under pressure for older Americans. Rising healthcare costs, inadequate savings, inflation, and unexpected expenses create significant risks—leaving many seniors vulnerable to economic hardship. The following data and insights highlight the most pressing financial challenges faced by today’s aging population and potential strategies to address them.
💊 Rising Healthcare and Prescription Drug Costs
In 2025, a new $2,000 annual cap on Medicare Part D out-of-pocket prescription drug costs—introduced under the Inflation Reduction Act—will save over 3.2 million beneficiaries money, with many saving more than $1,000 annually. High-cost medications, such as those for chronic illnesses, remain a major burden, with some patients previously paying over $10,000 a year. While the cap provides significant relief, those relying on branded drugs still face substantial costs.
🏥 The High Price of Long-Term Care
Long-term care remains one of the most underestimated retirement expenses. The average annual cost of nursing home care in the U.S. exceeds $111,000, yet 60% of Americans estimate it at $50,000 or less. By 2033, around 16 million middle-income older adults are projected to be unable to afford the health, personal care, and housing services they need. Medicare coverage for long-term care is limited, and Medicaid eligibility requires strict income thresholds—leaving many families “too wealthy” for assistance yet unable to meet the costs.
📈 Inflation, Taxes, and Social Security Uncertainty
The 2025 Allianz Annual Retirement Study found that 64% of Americans worry more about running out of money in retirement than dying. Top concerns include high inflation (54%), insufficient Social Security benefits (43%), and high taxes (43%). Inflation hits boomers the hardest, with 61% citing it as a primary worry. In addition, Social Security was never intended to cover all retirement needs, making supplemental savings critical.
💳 Inadequate Retirement Savings and Debt Burdens
A significant share of older Americans are entering retirement with insufficient savings—62% report not saving as much as they would like. Everyday expenses, credit card debt, and housing costs erode the ability to save. The estimated cost for a “comfortable” retirement now stands at $1.26 million, yet many retirees fall far short of this goal.
🧮 The Sandwich Generation’s Financial Strain
Nearly 29% of caregivers belong to the “sandwich generation,” supporting both aging parents and children. Many of these caregivers spend more than half their income on caregiving costs and face career interruptions, with 51% of sandwich generation mothers leaving jobs due to these responsibilities. This dual financial pressure limits their ability to save for their own retirement.
💡 Potential Strategies for Reducing Vulnerabilities
Experts recommend creating a detailed retirement plan, paying down high-interest debt, and maximizing tax-advantaged retirement accounts (e.g., 401(k)s, IRAs, HSAs). Building an emergency fund, diversifying investments, and considering long-term care insurance can provide additional protection. For some, extending their working years or re-entering the workforce (“unretiring”) may help bridge financial gaps.
Source:
American Association of Retired Persons. AARP, Senate Leaders Urge Stronger Fraud Protections for Older Americans
United States Census Bureau. Majority of Older Adults in Poverty in 2021 Lived Alone
United States Census Bureau. Child Poverty Rates Dropped in 8 States While Poverty Rates for Older Population Rose in 10 States
Reuters. Biden cap on drug costs will save US seniors over $1,000 a year, study finds
Kiplinger. Why More People Fear Going Broke in Retirement Than Dying
Trends in Income and Wealth Inequality Among Seniors
Income and wealth inequality among older Americans has been widening over the past several decades, with significant implications for economic security in retirement. GAO’s analysis of U.S. Census Bureau and Federal Reserve data highlights disparities across income levels, racial and ethnic groups, and educational backgrounds.
📈 Rising Income Inequality Among Older Adults
Between 1989 and 2016, the gap between high- and low-income older households widened considerably. Households in the top 20% of the senior income distribution saw their average income increase by 75%, while those in the bottom 20% experienced a decline of 4% (adjusted for inflation). This divergence reflects broader national trends in wage growth, investment income, and retirement savings access.
💰 Concentration of Wealth in the Top Tier
Wealth among older Americans is increasingly concentrated in a small share of households. In 2016, the top 20% of senior households by wealth controlled about 88% of all senior household net worth, up from 81% in 1989. Conversely, the bottom 20% held virtually no wealth, often carrying more debt than assets. Housing equity and retirement accounts remain the largest components of senior wealth, but access to these assets is uneven.
🏠 Housing Wealth and Disparities
Homeownership continues to be a critical driver of wealth for older adults, but not all seniors benefit equally. White, non-Hispanic seniors are more likely to own their homes outright and have higher median housing equity compared to Black and Hispanic seniors. In 2016, median housing equity for White seniors was more than double that of Black seniors, contributing to persistent racial wealth gaps.
🎓 Education as a Wealth Divider
Educational attainment plays a major role in senior financial outcomes. Seniors with a bachelor’s degree or higher have median household wealth roughly four times greater than those without a high school diploma. This disparity reflects both lifetime earnings differences and access to employer-sponsored retirement plans.
📊 Implications for Retirement Security
The growing concentration of income and wealth among higher-income seniors raises concerns about the economic well-being of lower-income retirees. Those with limited savings are more vulnerable to rising health care costs, market volatility, and unexpected expenses, increasing reliance on Social Security as their primary or sole source of income.
Economic Impact of Inflation and Rising Costs
Rising prices and everyday expenses are reshaping retirement plans across America. For many older adults, the challenge isn’t just saving enough—it’s making sure that savings can keep pace with the increasing cost of living.
📈 Inflation as a Leading Retirement Concern
According to the 2025 Allianz Annual Retirement Study, more than half of respondents (54%) said that high inflation is their top reason for fearing they will run out of money in retirement. Among baby boomers, this concern is even more pronounced, with 61% citing inflation as a major factor—compared to 56% of millennials and 55% of Gen Xers.
🏦 Pressure on Social Security and Taxes
Alongside inflation, 43% of retirees worry that Social Security will not provide enough financial support, while another 43% are concerned about rising taxes eroding their income. These pressures can significantly reduce purchasing power during retirement.
👥 Generational Differences in Financial Anxiety
The fear of financial shortfall is widespread, but Gen X—many of whom are in their 40s and 50s—are the most concerned, with 70% expressing worry about running out of money. They are followed by millennials (66%) and boomers (61%). These concerns reflect both current economic realities and uncertainty about future retirement benefits.
💰 The Squeeze on Retirement Savings
Inflation and higher living costs also make it harder to save for the future. Day-to-day necessities (63%), credit card debt (40%), and mortgage or rent payments (35%) are cited as major reasons people are unable to put aside as much as they would like for retirement. Over time, this financial squeeze can limit the growth of retirement funds and force difficult lifestyle adjustments.
Source:
Kiplinger. Why More People Fear Going Broke in Retirement Than Dying
Gift Preferences and Consumer Spending Habits Among Seniors
Spending habits among older adults reflect their values, lifestyle, and evolving needs. Senior citizens statistics in 2025 reveal how seniors approach gift-giving, shopping, and everyday purchases—offering insights into their roles as both consumers and recipients in the modern economy.
Common Gift Preferences Among Seniors
Gift-giving among seniors reflects both deep family connections and evolving consumer habits. Surveys from AARP and the National Retail Federation (NRF) reveal who seniors buy for, how much they spend, and the types of gifts they prefer — offering a clear picture of how this tradition shapes seasonal spending.
🎁 Gift Recipients and Preferences
According to AARP’s 2021 Holiday Shopping and Travel Poll, over eight in ten adults aged 50 and older (83%) planned to buy gifts for holidays or special occasions. Children (74%) and grandchildren (53%) topped the list of recipients, followed by friends, siblings, other relatives, and parents. Women were more likely than men to purchase for a wider range of people, including service workers, friends, and parents.
💵 Holiday Spending Patterns
The NRF’s 2024 survey found that U.S. consumers planned to spend a record $902 per person during the winter holidays, with about $641 dedicated to gifts for family, friends, co-workers, and others. This marks an increase from $620 in 2023 and exceeds the previous high set in 2019. Among older adults, AARP reported an average holiday gift budget of $500, though 15% expected to spend over $1,000. Most (71%) kept spending levels steady compared to the previous year, while 17% planned cutbacks.
🛍️ Shopping Channels and Gift Categories
Online shopping remains the top choice for holiday purchases (57%), followed by department stores (46%), grocery stores or supermarkets (46%), and discount stores (45%). Gift cards continue to be the most requested item (53%), followed by clothing and accessories (49%), books and other media (28%), and personal care or beauty items (25%).
📊 Demographic Variations
Gift-giving patterns vary across demographic groups. Women aged 50+ are more likely than men to reduce holiday spending (21% vs. 13%) and to shop for a broader range of recipients. African American/Black older adults were more likely than white counterparts to cut back on spending (33% vs. 13%).
Source:
American Association of Retired Persons. Older Adults Focusing on Family this Holiday Season
National Retail Federation. 2024 Holiday Spending Expected to Reach New Record
Spending Habits and Purchasing Behavior
Older adults remain active participants in seasonal shopping, often prioritizing gifts for family while balancing budgets and personal preferences. Holiday spending patterns reveal both consistency in traditions and shifts in purchasing behavior driven by economic conditions, convenience, and social priorities.
🎁 Gift Spending Patterns
AARP’s survey shows that 83% of adults aged 50+ plan to buy gifts for holidays or other observances, with children (74%) and grandchildren (53%) as top recipients. Friends, siblings, and parents also make the list, with women purchasing for a wider range of people than men, including service workers in their lives. On average, older adults plan to spend $500 on gifts, and 15% expect to spend over $1,000.
📈 Total Holiday Budget Allocation
NRF data highlights a broader view of seasonal spending, with U.S. consumers planning to spend an average of $902 across gifts, food, decorations, and other items — a $25 increase from the previous year and the highest on record. Of this total, $641 is dedicated to gifts for family, friends, and co-workers, while $261 goes to seasonal extras such as food or décor.
⏳ Timing of Purchases
Nearly 45% of shoppers start browsing and buying before November, motivated by spreading out budgets (59%), avoiding last-minute stress (45%), sidestepping crowds (42%), and securing unmissable promotions (42%). Despite early shopping trends, 62% still complete their purchases in December.
🛍️ Shopping Destinations and Methods
Online shopping remains the top choice, with 57% of consumers planning to buy holiday items online, followed by department stores (46%), grocery/supermarkets (46%), and discount stores (45%). While younger consumers lean toward thrift and resale shops for sustainability and cost savings, older adults continue to favor traditional retail and online convenience.
📉 Adjustments and Cutbacks
Economic pressures influence spending choices — 17% of older adults report cutting back on holiday shopping compared to the prior year, with women (21%) more likely than men (13%) to reduce spending. Among racial groups, African American/Black older adults (33%) are more likely than white counterparts (13%) to make such adjustments.
Source:
American Association of Retired Persons. Older Adults Focusing on Family this Holiday Season
National Retail Federation. 2024 Holiday Spending Expected to Reach New Record
Influences on Consumer Decisions
For Americans aged 55 and older, holiday shopping is less about chasing the latest trends and more about making smart, meaningful choices. Their decisions are shaped by a blend of financial prudence, practicality, and trust — often leaning toward a slower, more deliberate buying process compared to younger shoppers.
💡 Budgeting with Intent
- 56% of older shoppers plan to tighten their holiday budgets due to inflation — not to spend less for its own sake, but to spend smarter.
- Only 7% intend to increase their holiday spending, while 22% will keep it the same despite rising costs.
- Value for money, rather than extravagance, is the core priority.
🏷️ Brand Names? Not Always a Priority
- 38% of shoppers 55+ don’t focus heavily on brand names.
- Store brands are perfectly acceptable if the product delivers quality and practicality.
⏳ Timing and Planning
- 45% spread purchases out over several months, 38% buy early to avoid price hikes.
- Black Friday and Cyber Monday still matter, but only 30% are primarily sales-driven.
- 17% start as early as September, 9% shop between April–July.
💳 Paying in Full Over BNPL
- 68% prefer to pay in full, avoiding “Buy Now, Pay Later” options.
- Only 7% are using BNPL more this year.
🚚 Shipping Preferences
- 45% would add an extra item to qualify for free shipping.
- Only 9% would add items for faster shipping, and just 4% would pay extra for it.
🏬 Where They Shop
- 51% start holiday shopping at malls, 28% at local non-chain stores.
- Physical stores are still dominant, though 27% do most shopping online with some in-store visits, and another 27% split equally.
📱 Digital Influence (or Lack Thereof)
- Only 30% discover gift ideas on social media, and just 14% have ever purchased directly through a social platform.
- 88% are not influenced by content creators when holiday shopping.
- Instead, 61% rely on product reviews and 32% use gift guides to inform decisions.
🔍 Trust and Authenticity
- 56% would buy a gift with no reviews only if the brand or product is trusted.
- 48% look for both positive and negative reviews, 32% check if reviews sound authentic.
- 45% are less likely to buy from brands using AI-generated content, and 28% are concerned about AI-written product reviews.
Source:
American Association of Retired Persons. Older Adults Focusing on Family this Holiday Season
National Retail Federation. 2024 Holiday Spending Expected to Reach New Record
The Bazaar Voice. What influences 55+ crowd holiday shopping decisions
Trends in E-Commerce and Digital Shopping Among Seniors
While in-store shopping continues to dominate overall retail sales in the U.S., e-commerce has steadily expanded its share—and seniors are increasingly part of this shift. Understanding these trends helps paint a clearer picture of how older Americans are adapting to the digital marketplace.
📈 Long-Term Growth in Online Retail
Since the U.S. Census Bureau began tracking online sales in 1999, the share of retail conducted online has risen from just 0.7% in late 1999 to 16.3% in the fourth quarter of 2022. Growth has been particularly strong during the holiday season, with Q4 sales consistently outpacing the rest of the year. The COVID-19 pandemic accelerated this adoption: e-commerce’s share of all retail sales jumped to a record 16.7% in Q4 2020, driven by store closures and stay-at-home orders, and has remained well above pre-pandemic levels since.
🖥️ Seniors’ Growing Comfort with Online Shopping
Older consumers, traditionally more reliant on in-person retail, have embraced digital shopping at a faster pace over the past five years. AARP surveys indicate that more than half of adults 50+ now make at least some of their purchases online, with the proportion higher among those who are regular smartphone or tablet users. Many seniors combine online convenience with traditional habits, using e-commerce for specific items—such as gifts, books, or specialty products—while still visiting local stores for groceries and everyday goods.
🛍️ Seasonal Patterns and Preferred Channels
Holiday periods are a major driver of online purchases for all age groups, including seniors. While younger shoppers may focus on speed and exclusive online deals, seniors tend to value free shipping, easy navigation, and clear product descriptions. According to recent consumer research, around 63% of older adults still include in-store visits in their holiday shopping plans, but a growing share now mixes in online orders—especially for sending gifts to distant family members.
🛒 Product Categories and Retailer Types
Nonstore retailers—those without physical locations—capture the largest share of online sales, taking nearly 62% of e-commerce purchases in 2023. For seniors, this often includes trusted online marketplaces and brand-direct websites. Categories like general merchandise, health and personal care, and food & beverage have seen steady online growth among older shoppers, reflecting both convenience and health-conscious purchasing.
🔄 Hybrid Shopping Habits Are Here to Stay
Rather than fully replacing in-store visits, e-commerce has become part of a hybrid approach for seniors. Many browse online to compare products and prices, then decide whether to purchase digitally or in-store. Reviews, detailed product images, and the ability to easily return items are major factors influencing whether seniors complete their purchases online.
Source:
American Association of Retired Persons. Older Adults Focusing on Family this Holiday Season
National Retail Federation. 2024 Holiday Spending Expected to Reach New Record
The Bazaar Voice. What influences 55+ crowd holiday shopping decisions
Pew Research Center. Online shopping has grown rapidly in U.S., but most sales are still in stores
Employment Trends and Part-Time Work After Age 65
Many Americans are choosing to work beyond traditional retirement age, whether for financial reasons or personal fulfillment. Senior citizens statistics from 2025 highlight key employment trends among older adults, including part-time work, encore careers, and shifting attitudes toward retirement.
Workforce Participation Rates Among Older Adults
The share of Americans age 65 and older who remain in the workforce has shifted dramatically over the past seven decades.
When the U.S. Bureau of Labor Statistics (BLS) first began tracking these figures in 1948, 27.0% of older adults were working or actively seeking work — with a notable gender gap: 46.8% of men versus just 9.1% of women.
Participation rates gradually declined through the latter half of the 20th century, hitting a low point in 1985 at 10.8% (15.8% for men and 7.3% for women). This decline reflected both increased access to retirement benefits and cultural norms that encouraged full retirement by age 65.
Since then, however, the trend has reversed. By 2024, 19.5% of Americans age 65+ were in the labor force (23.4% of men and 16.2% of women). This rebound is driven by a combination of factors:
- Longer life expectancy and better health among older adults
- Economic necessity due to insufficient retirement savings or rising costs
- A desire for continued purpose, social engagement, and income
Even with this increase, older Americans remain less likely to work than younger cohorts. In 2024, the labor force participation rate was:
- 83.6% for ages 25–54
- 65.9% for ages 55–64
- 55.9% for ages 16–24
- 62.6% overall for the population age 16+
Out of 168.1 million total U.S. workers in 2024, about 11.6 million — roughly 7% — were age 65 and older. This underscores a growing but still relatively small share of the workforce, with significant implications for employment policy, retirement planning, and age-friendly workplace practices.
Source:
US. BUREAU OF LABOR STATISTICS. Golden years: older Americans at work and play
Types of Jobs and Industries with High Senior Participation
Older adults over the age of 65 are employed across a wide range of industries, but some sectors tend to have a higher concentration of senior workers due to the nature of the work, flexibility in scheduling, and opportunities for part-time or less physically demanding roles.
📋 Management, Business, and Financial Roles
Many seniors continue to work in management, business, and financial occupations because these positions rely heavily on accumulated experience, decision-making skills, and industry knowledge. These roles often provide flexible arrangements, consulting opportunities, and part-time advisory work, making them attractive for retirees who still wish to remain professionally active.
🧑🏫 Education, Training, and Library Occupations
Education remains one of the most common sectors for older workers. Teachers, professors, tutors, and librarians benefit from decades of expertise and can often work on a part-time or substitute basis. This sector also allows seniors to stay intellectually engaged while contributing to the community.
🛍 Sales and Related Occupations
Sales roles—especially in real estate, retail, and wholesale trade—offer seniors opportunities to leverage interpersonal skills and client relationships built over a lifetime. These jobs often provide commission-based income and flexible scheduling, which can be appealing after retirement.
🖋 Office and Administrative Support
Clerical and administrative work attracts many seniors because it can be less physically demanding and may allow for part-time or seasonal employment. Positions such as receptionists, office clerks, and administrative assistants often suit those who prefer structured, predictable work environments.
⚖ Legal, Community, and Social Services
Experienced attorneys, paralegals, social workers, and community service coordinators often continue working beyond retirement age. These roles allow older adults to use their expertise to address legal needs, advocate for others, and contribute to social causes.
🎨 Arts, Design, Entertainment, and Media
Creative fields often retain older workers who bring a lifetime of artistic development, storytelling skills, and cultural knowledge. This includes writers, musicians, artists, designers, and media professionals, many of whom work on a freelance or contract basis well into later life.
Across these sectors, the appeal for seniors often lies in flexibility, meaningful engagement, and the ability to leverage decades of skills and experience while avoiding overly strenuous physical demands.
Source:
U.S. BUREAU OF LABOR STATISTICS. 18b. Employed persons by detailed industry and age
Reasons for Working After Retirement Age
While retirement traditionally signals a shift away from paid work, a significant number of older Americans choose—or need—to remain in the labor force well past the conventional retirement age. In 2024, nearly one in five people aged 65 and older (19.5%) were still working or actively seeking work, up from historic lows in the mid-1980s.
💰 Financial Stability and Rising Costs
For many older adults, fixed retirement income is not enough to keep pace with the rising costs of housing, healthcare, and daily living. Continuing to work provides an essential supplement to Social Security and pension benefits, helping to maintain a comfortable standard of living.
💡 Personal Fulfillment and Identity
Work is more than just a paycheck—it offers purpose, structure, and a sense of belonging. Many seniors enjoy the intellectual challenge, social interaction, and personal satisfaction that work provides.
🩺 Access to Benefits
Some seniors remain employed to retain employer-sponsored health insurance or other workplace benefits, bridging the gap until they qualify for Medicare or to complement existing coverage.
📈 Changing Retirement Norms
With longer life expectancy and improved health, the concept of a “fixed” retirement age has shifted. For many, staying in the workforce into their late 60s or early 70s feels both feasible and desirable.
⏳ Preference for Part-Time or Flexible Work
The availability of part-time schedules, seasonal roles, and remote work allows older adults to remain engaged without the demands of a full-time job. In 2024, 38.3% of employed seniors worked part time—more than double the rate of workers aged 25 to 54.
In short, today’s older workers are redefining what it means to “retire.” For some, work after 65 is a lifeline; for others, it’s an opportunity to keep contributing, stay active, and remain connected to their communities.
Source:
U.S. BUREAU of LABOR STATISTICS. Golden years: older Americans at work and play
U.S. BUREAU of LABOR STATISTICS. AMERICAN TIME USE SURVEY — 2024 RESULTS
Challenges Faced by Seniors in the Workforce
While many older adults choose to remain in the workforce for social engagement or personal fulfillment, a significant number do so out of necessity. Seniors face a range of challenges that can limit their job options, reduce income stability, and impact their overall well-being. From financial insecurity to health limitations, policy changes, and age-related bias, these obstacles often intersect — making continued employment after traditional retirement age increasingly complex.
📉 Financial Insecurity and Limited Retirement Savings
Many seniors continue working out of necessity rather than choice. An AARP survey found that 1 in 5 Americans aged 50 and older have no retirement savings.
- Among people aged 75 and older, the median income in 2022 was about $49,100, down 2% from 2019, and the median net worth was $335,600 — figures that can be quickly eroded by rising living costs or unexpected expenses.
- Personal stories illustrate this reality: Sandy McConnell, 80, works full-time earning $50,000 annually but is $70,000 in debt after medical and family expenses; June Boyd, 90, relies on part-time work and Social Security just to cover utilities, insurance, and mortgage payments.
💊 Health Issues and Workplace Safety Risks
While older workers are less likely to experience non-fatal injuries, their injuries are more likely to be serious or fatal, especially after age 60.
- This higher severity can lead to longer recovery periods, medical bills, and job loss.
- Many seniors face chronic health conditions — such as heart disease, reduced mobility, or cancer — which limit job options and increase absenteeism, making sustained employment more challenging.
🏛 Policy Changes and Benefit Eligibility Barriers
Recent policy shifts have created additional obstacles for older workers:
- New work requirements for people aged 50–64 to qualify for Medicaid and the Supplemental Nutrition Assistance Program (SNAP) increase pressure on those already facing health or mobility limitations.
- The pause in funding for the Senior Community Service Employment Program (SCSEP) — a federal initiative providing income and job training for low-income seniors — has resulted in more than 19,500 participants losing their positions nationwide. For many, the $580+ monthly stipend was critical for paying rent, utilities, and medical bills.
🚪 Age Discrimination and Limited Job Opportunities
Older adults often encounter explicit or implicit age discrimination in hiring, promotions, and training opportunities.
- Many report being offered only low-wage or part-time roles in retail or nonprofits, despite decades of experience.
- Self-employment can be a solution, but not all have the capital or health capacity to sustain a business. In the 80+ workforce, 27% are self-employed, with many starting businesses out of necessity rather than passion.
🏠 Family Responsibilities and Multigenerational Support
Financial obligations don’t always end with retirement age.
- Some seniors are primary caregivers for adult children, grandchildren, or spouses with chronic illness.
- For example, Sandy McConnell supported 13 family members at one point, while June Boyd contributes to her daughter’s cancer care and supports 14 great-grandchildren. These responsibilities often consume limited income and delay retirement indefinitely.
🧠 Psychological and Emotional Pressures
Beyond finances, continued work into advanced age can carry emotional strain:
- The stress of unstable income, mounting bills, and health worries can lead to anxiety or depression.
- Others feel pressure to maintain productivity and “purpose” to combat societal stereotypes about aging — sometimes at the expense of rest or leisure.
Source:
American Association of Retired Persons. Age Discrimination Still Rampant in U.S. Workplaces
American Association of Retired Persons. A Sharp Increase in the Number of Older Americans Seeking a Job Change
U.S. Bureau of Labor Statistics. Golden years: older Americans at work and play
CDC. Aging Workers Data and Statistics. Aging Workers Data and Statistics
Business Insider. They’re in their 80s, still working, and living paycheck to paycheck
MarketWatch. Older adults on ‘edge of poverty’ lose jobs and funding as new Medicaid and SNAP work requirements loom
Employer Policies and Retirement Flexibility Trends
Longer life expectancies, lower birth rates, and shifting workforce priorities are reshaping how employers approach retirement. Traditional “three-stage” career models — education, full-time work, then retirement — are giving way to more flexible, cyclical paths that blend earning, learning, and periods of rest. Employers are increasingly adopting policies that allow older workers to remain productive while enjoying greater work-life balance.
🕰️ Shifting Worker Priorities and Demand for Flexibility
AARP’s Value of Experience survey highlights how the COVID-19 pandemic accelerated a rethinking of work. Among adults age 40 and older:
- 79% say flexible work hours are a job requirement.
- 66% would only accept a job if remote work is an option at least part of the time.
- 90% say their work must feel meaningful.
These preferences are particularly pronounced among caregivers — over one-third of older workers provide care for an adult, and many have had to reduce hours, change schedules, or leave jobs altogether. Flexible policies are no longer a “perk” but an expectation.
🏢 Employer Strategies for Retaining and Engaging Older Workers
Organizations are experimenting with a variety of models to keep older employees engaged:
- Independent Contracting and Consulting
Retirees can be re-engaged on a project basis, offering specialized expertise, mentoring, or interim leadership without committing to full-time schedules. In 2017, 37% of independent contractors were age 55+, up from 27% in 2005. - Returnships
Structured programs that bring back experienced workers after career breaks, easing re-entry and allowing both sides to “test the waters.” - Phased Retirement
Allows employees to gradually reduce hours before full retirement. Employers benefit from predictable transition timelines and deliberate knowledge transfer. Some organizations adjust pension formulas to avoid penalizing participants. - Alumni Networks
Staying connected with former employees opens channels for consulting, mentoring, volunteerism, and rehiring.
🌅 Flextirement in Practice
The concept of flextirement — a modern take on phased retirement — blends part-time schedules with continued benefits.
- HireClix designed a flextirement plan to retain a senior client services director, preserving client relationships and enabling mentorship.
- WeLoveDoodles offers fully customized timelines for reduced hours, improving employer brand and easing succession planning.
- AIscreen reports a 15% increase in satisfaction and a 20% drop in turnover costs after implementing phased retirement plans.
These examples show that flexible retirement models are not only feasible but also mutually beneficial — older workers gain autonomy and balance, while employers retain institutional knowledge and leadership continuity.
💼 Gig and Independent Work as Alternatives
Not all older adults choose employer-based flexibility. Over a quarter (27%) of older workers now engage in gig or freelance work, with 87% citing flexible hours as a key motivator. For many, this approach offers control over workload and schedule without leaving the workforce entirely.
🔮 Looking Ahead
As the proportion of older workers continues to grow, retirement flexibility will likely expand beyond phased retirement into broader career-cycle planning. Forward-thinking employers are treating flexibility as a strategic asset — one that supports worker well-being, mitigates talent shortages, and strengthens organizational resilience.
Source:
Society of Actuaries. Flexible Work and Phased Retirement: Practical Issues for Employers
United States Government Accountability Office. OLDER WORKERS Phased Retirement Programs, Although Uncommon, Provide Flexibility for Workers and Employers
American Association of Retired Persons. Flexible Retention Strategies for Older Workers
American Association of Retired Persons. Gig Work on the Rise Among Older Adults as Demand for Workplace Flexibility Grows
American Association of Retired Persons. Is a ‘Flextirement’ Job a Good Fit for You?
FAQ: Senior Citizens Statistics
What are some popular hobbies among older adults?
Many seniors enjoy gardening, reading, cooking, walking, and creative activities such as painting or writing. Hobbies are a great way to stay active, social, and engaged.
How can seniors stay socially connected after retirement?
Joining local clubs, volunteering, attending community events, and taking part in group activities are all great ways for older adults to build and maintain friendships.
Are there benefits to learning new skills later in life?
Yes. Lifelong learning can improve cognitive health, boost confidence, and open new opportunities for enjoyment — whether it’s learning a language, a musical instrument, or a digital skill.
What role does travel play in retirement?
Many retirees use their newfound free time to explore destinations near and far. Travel offers opportunities for relaxation, adventure, and making memories with family and friends.
Where can I find uplifting short stories written for seniors?
You can explore our Free Short Stories for Seniors collection — heartwarming, large-print stories perfect for relaxing afternoons or sharing with friends.
How old is a senior citizen in the United States?
The answer can vary depending on the benefit or program. Learn more in our detailed guide, When Are You Considered a Senior Citizen? Age Guidelines, Definitions, and Benefits.
This page was last updated in June 2025. Future updates will reflect new Census releases, mortality data, and demographic trends.


